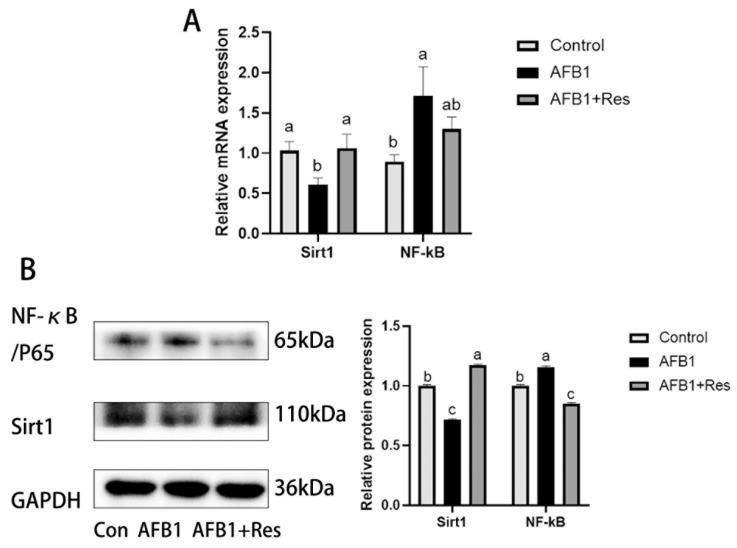
Figure 8.
Effect of Res on the expression levels of Sirt1 and NF-κB in duck liver exposed to AFB1. Values are represented as the mean ± SEM (n = 6). a–c Mean values with same superscript letters or no letters within a row were of no significant difference (p > 0.05), those with different superscript letters were of significant or extremely significant difference (p < 0.05). (A) mRNA levels of Sirt1 and NF-κB genes. (B) protein levels of Sirt1 and NF-κB genes.

