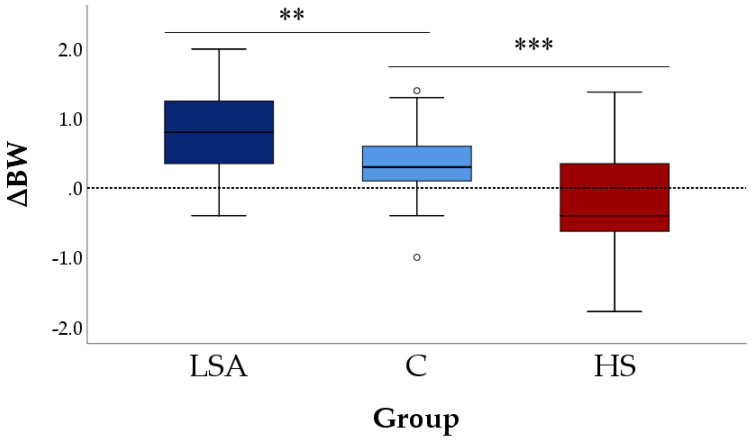
Figure 4.
Changes in body weight (∆BW) during the simulations in the three groups. Each box plot shows the median, interquartile ranges, low and high extreme values (one and a half times the interquartile range if outliers are present); dots show outliers. LSA = Low Space Allowance group (0.20 m2/lamb in TNZ), C = Control group (0.27 m2/lamb in TNZ), HS = Heat Stress group (0.27 m2/lamb above the comfort zone of the TNZ). *** p < 0.001, ** p < 0.01 compared to the C group (Dunnet post hoc test).

