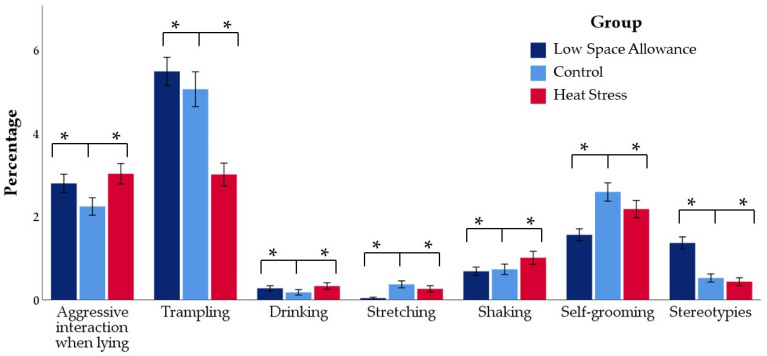
Figure 7.
Relative proportions of the main behavioral variables included in the Interactions and Other behaviors categories (not mutually exclusive) in the three groups (mean percentage of events in relation to the number of visible animals collected every 5 min over a 19-h observation period). * p < 0.05 compared to the Control group.

