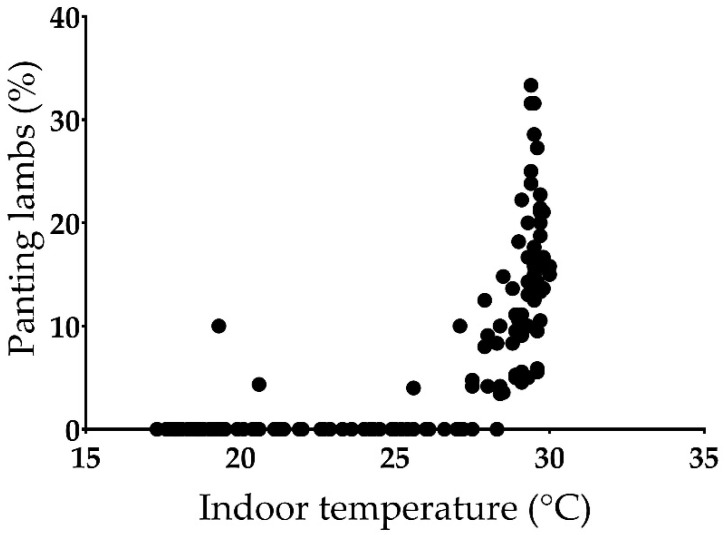
Figure 9.
Scatter plot showing the relationship between the proportion of panting animals and indoor temperature for the simulation conducted during the late-spring period (Heat stress group). No panting animals were observed in the simulations conducted during the Thermoneutral zone (Control and Low Space Allowance groups).

