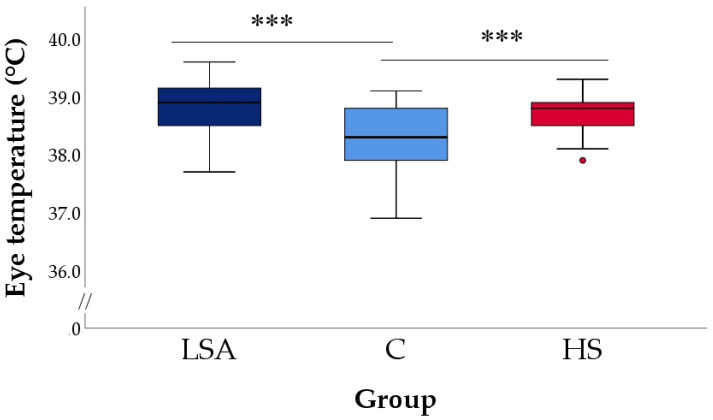
Figure 10.
Eye temperature collected at the end of the simulation in lambs of the three groups. Each box plot shows the median, interquartile ranges, low and high extreme values (one and a half times the interquartile range if outliers are present); the dot shows an outlier. LSA = Low Space Allowance group (0.20 m2/lamb in TNZ), C = Control group (0.27 m2/lamb in TNZ), HS = Heat Stress group (0.27 m2/lamb above the TNZ). *** p < 0.001 compared to the C group (Dunnet post hoc test).

