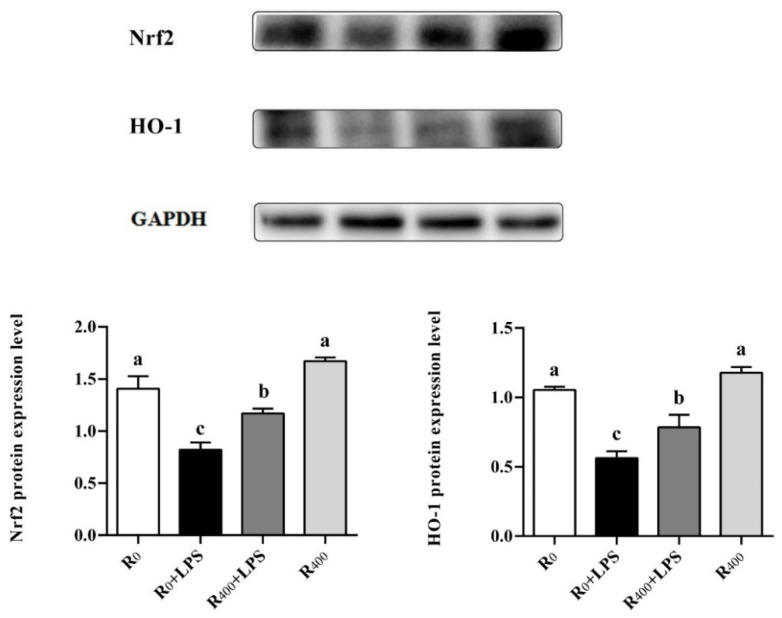
Figure 2.
Effect of RES on the protein expression of Nrf2 and HO-1 in the liver of LPS-induced duck. Values are expressed as mean ± SEM. Labeled (a, b, c, a > b > c) means in a row without a common letter differ, p < 0.05. Original Western Blot figures in Figure S2.

