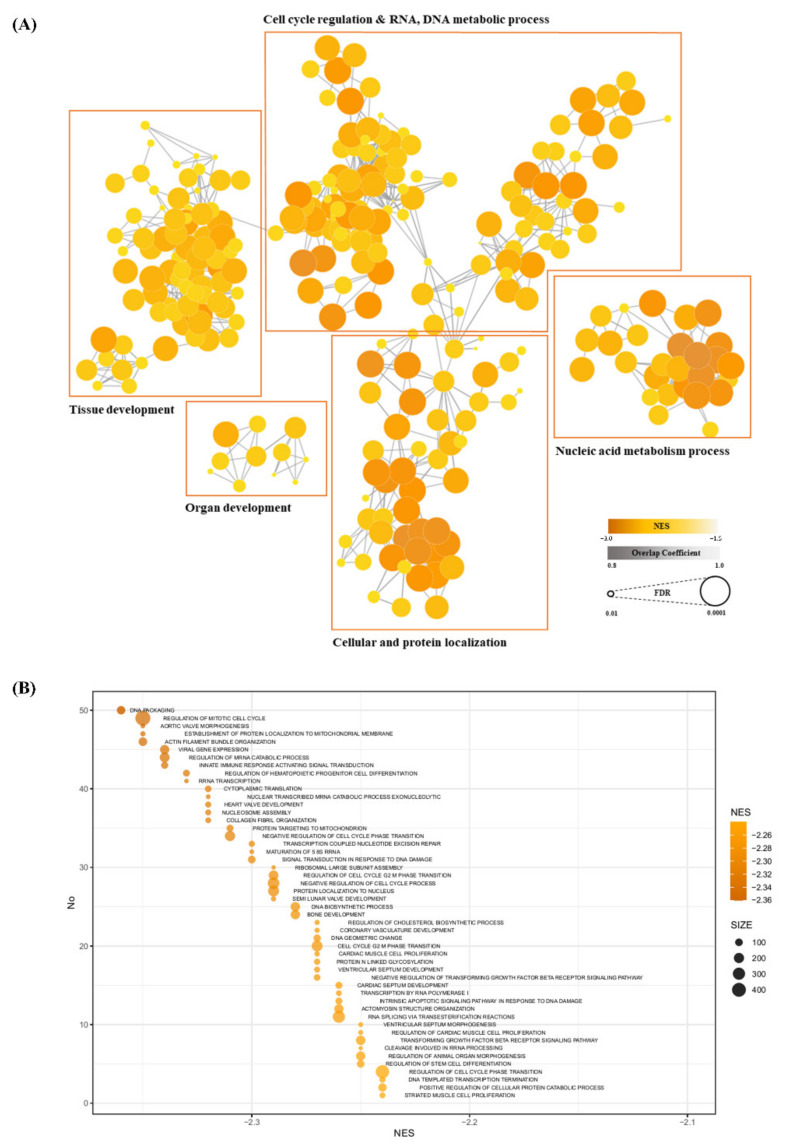
Figure 4.
Gene set enrichment analysis (GSEA) for BP. (A) Cytoscape visualizing functional enrichment analysis results from GSEA. Nodes represent each enriched BP term from GO. Thicknesses of lines represent overlap coefficients (levels of overlap between nodes). Node color and size indicate normalized enrichment scores (NESs) and false discovery rate (FDR) each. Nodes are clustered into groups of five by similarity of each function. (B) Top 50 terms regarding NESs in GSEA, shown as a bubble plot. Each node contains an NES and a gene set size value. Terms are involved in nucleic acid metabolism, cell cycle regulation, and cellular and protein localization.

