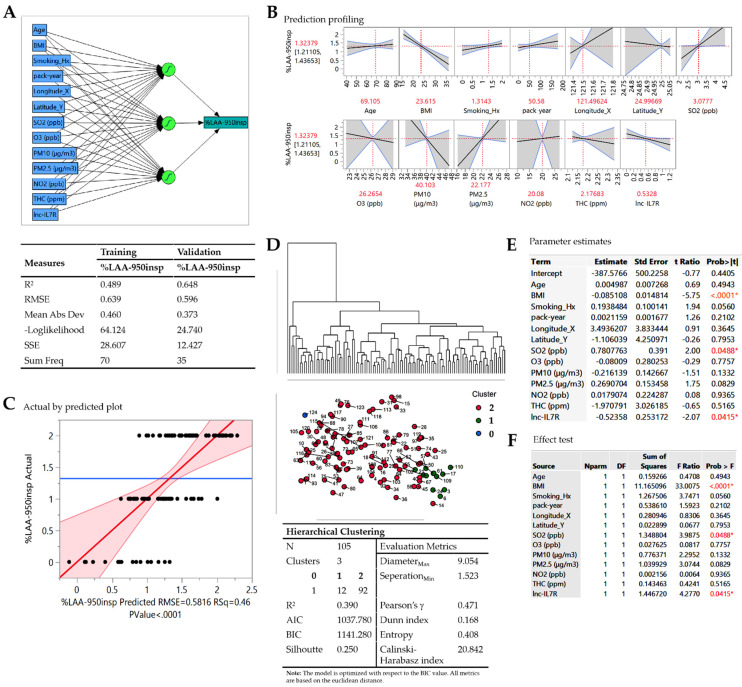
Figure 2.
Delineating predictors of disease severity in Taiwanese patients with COPD-E. (A) Artificial neural network (ANN) model schema (upper panel) and statistics chart (lower panel) showing the 13 disease-related variables of interest input, 3 auto-determined hidden, and predicted %LAA-950insp-based COPD-E severity output layers. (B) Prediction profiler showing the effect of age, BMI, smoking history, pack-year, longitude, latitude, SO2, O3, PM2.5, PM10, NO2, THC, and lnc-IL7R on predicted %LAA-950insp-based COPD-E severity. Cut-off values are indicated in red. (C) Actual vs. predicted %LAA-950insp-based COPD-E severity plot. (D) Hierarchical clustering dendrogram and statistics of severity-stratified COPD-E cases. (E) Parameter estimates, and (F) effect test charts of the panel of variables. R2, coefficient of determination; RMSE, root mean square error; SSE, sum of squared estimate of errors; Hx, history; ppb, part per billion; ppm, part per million; N, number of cases; AIC, Akaike’s Information Criteria; BIC, Bayesian Information Criteria; Values in red, statistically significant.

