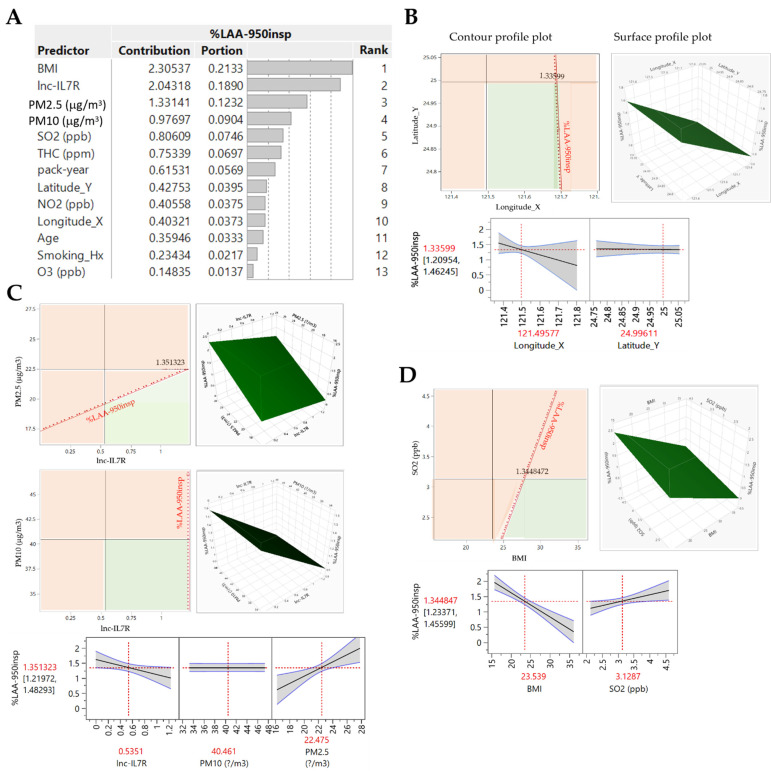
Figure 5.
BMI, lnc-IL7R, PM2.5, PM10, and SO2 are highly specific predictors of COPD-E severity and disease progression in New Taipei City. (A) Predictor screening chart showing the contribution and ranking of each variable in predicting COPD—E severity. Contour profile (upper left), surface profile (upper right), and predictor profiler (lower panel) plots for (B) longitude, latitude, (C) PM2.5, PM10, lnc-IL7R, (D) SO2, and BMI based on the Gaussian process model of %LAA-950insp-based COPD-E severity. Fit used Gaussian correlation function. Nugget parameter was set to avoid singular variance matrix.

