Figure 1.
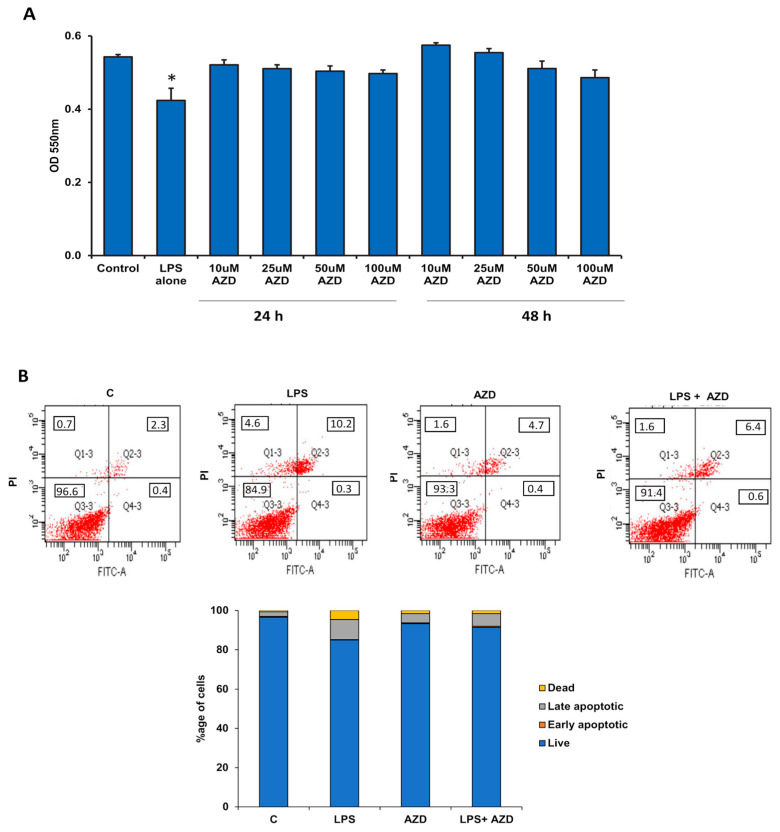
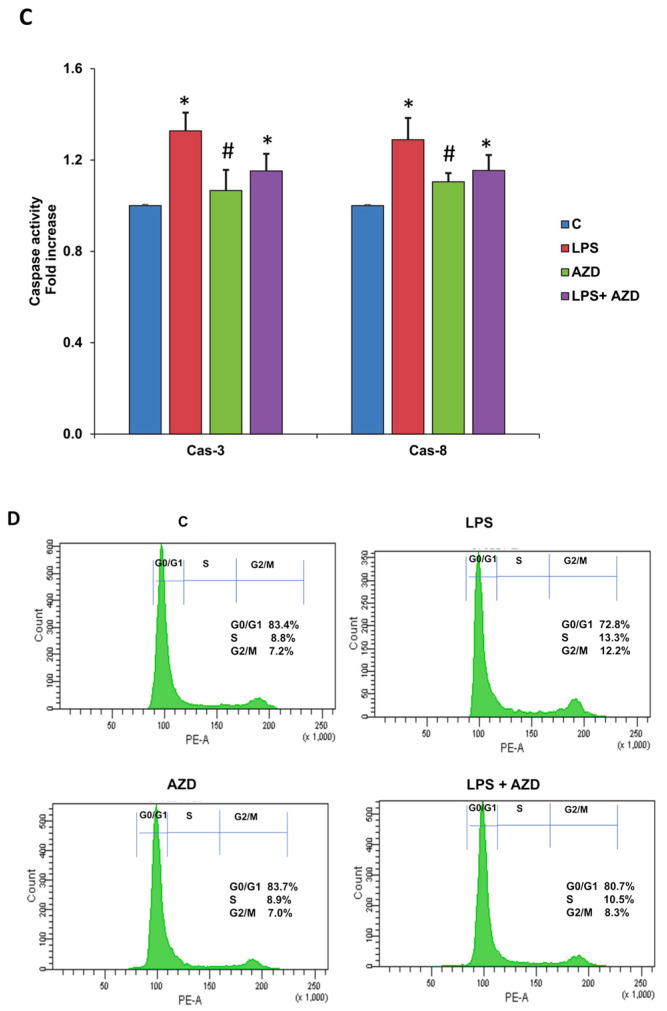
LPS-induced effects on cell viability, apoptosis, and cell-cycle regulation in Rin-5F cells. Rin-5F cells were treated with LPS alone (1 µg/mL) for 24 h and with different doses of AZD (10 µM to 100 µM) for different time intervals (24 h and 48 h), and MTT assay performed to assess cell viability (A). Apoptosis was measured in the cells treated with LPS (1 µg/mL) with or without AZD (25 µM) for 24 h by flow cytometry (B). A representative dot plot showing percentage of cells in the individual quadrants from three individual repetitive experiments is shown, and the average values are represented as a stacked column chart. Activities of caspases-3 and -8 were measured in treated and untreated cells colorimetrically using their respective substrates and the chromophore released was measured colorimetrically at a wavelength of 405 nm (C). Results are expressed as mean ± SD of three individual repetitive experiments. Asterisks indicate significant differences fixed at p ≤ 0.05 (* indicates significant difference relative to control untreated cells, whereas # indicates significant difference relative to LPS-treated cells). Cell cycle analysis was performed by staining the cells with propidium iodide, and the fluorescence was quantitated using the FACSCanto II Flow Cytometer at an excitation wavelength of 48 m with detection at 620 nm. Cell cycle data from the resulting histograms were analyzed with ModFit LT 3.2 software (Verity Software House; Topsham, ME) and expressed as percentage DNA distribution in each phase from three individual repetitive experiments. A representative histogram with DNA distribution in each phase is shown in (D).


