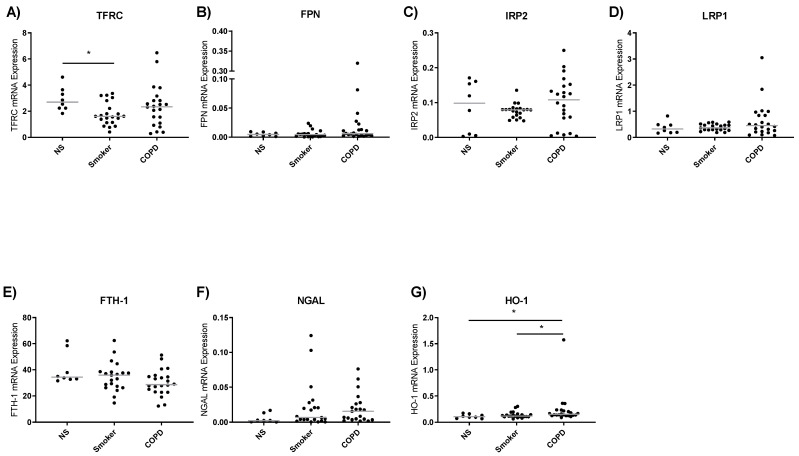
Figure 2.
Baseline lung macrophage iron metabolism gene expression. Real-time qPCR was used to assess levels of TFRC, FPN, IRP2, LRP1, FTH-1, NGAL and HO-1 expression of lung macrophage from non-smoker (NS) (n = 8), smoker (S) (n = 24) and COPD (n = 27) (A–G). Expression levels are relative to GAPDH (2−ΔCt). Data presented as individuals with median. Kruskal–Wallis multiple comparisons test was used to test differences between groups. * = p < 0.05.

