. 2021 Apr 23;11(25):15264–15272. doi: 10.1039/d1ra02530a

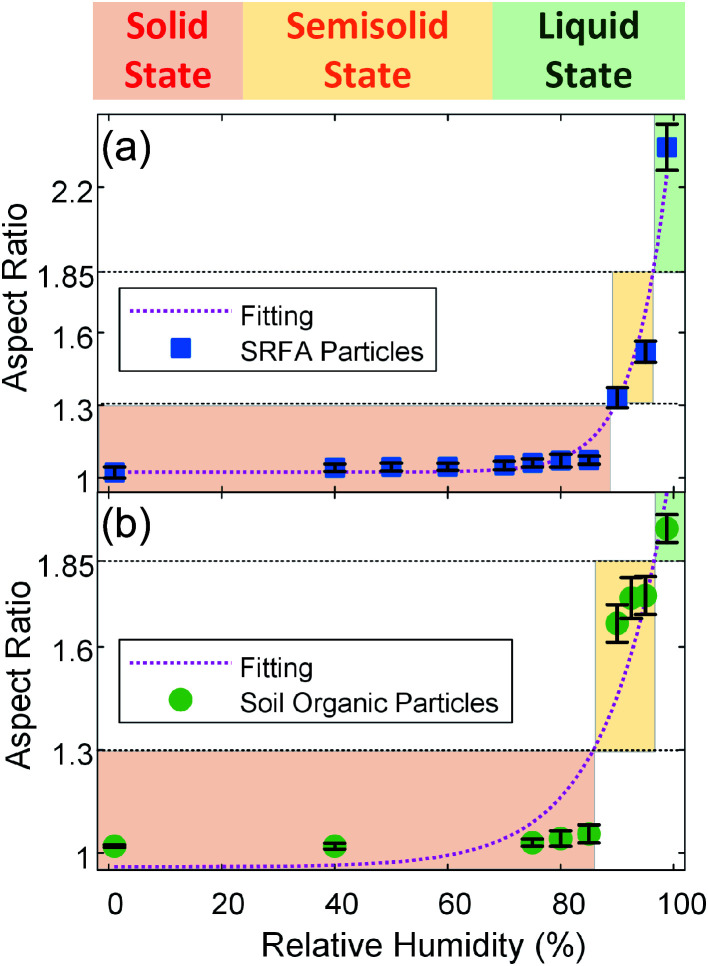
Fig. 4. Aspect ratio of the (a) SRFA particles and (b) soil organic particles averaged over the number of particles (>100) analyzed. Error bars indicate the standard error. The shaded region corresponds to the different phase state (red: solid state; yellow: semisolid state; green: liquid state). The black dotted lines are proposed thresholds of aspect ratio where solid to semisolid transition (aspect ratio = 1.30) and semisolid to liquid transition (aspect ratio = 1.85) occur. The dotted magenta lines are an exponential-decay fit (SRFA particles: aspect ratio = 1.12 × 10⁻⁷ exp(0.16 RH) + 1.02, R2 = 0.9715; soil organic particles: aspect ratio = 1.59 × 10⁻⁴ exp(0.089 RH) + 0.96, R2 = 0.8558).

Fig. 4