Figure 2.
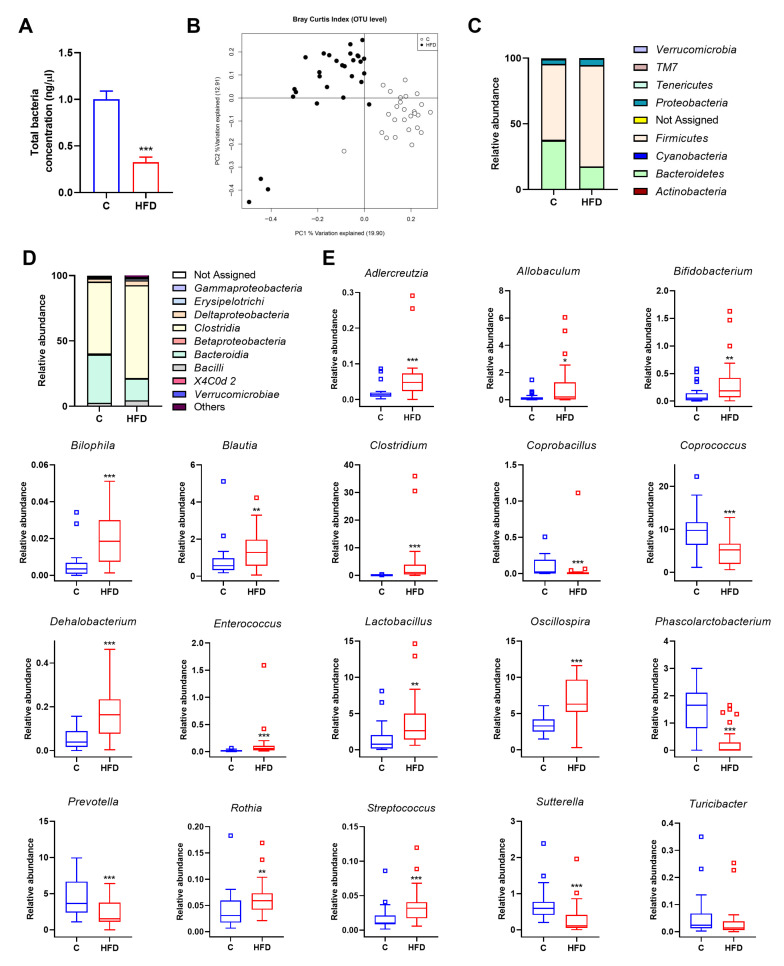
Effect of diet on microbiota composition in juvenile rats fed with control or HFD over six weeks. (A) Total bacteria concentration analysed by qPCR. Data represent mean ± SEM. *** p < 0.001 vs. C group. (B) Principal coordinates analysis (PCoA) plot based on Bray–Curtis dissimilarity index at the OTU level between rats fed with control or HFD. Percentage of the total variance explained is indicated in parenthesis in each axis. (C) Relative abundance at phylum level in the different experimental groups. (D) Relative abundance at class level in the different experimental groups. (E) Differences in the relative abundance between rats fed with control or HFD at genus level. Statistical analysis was performed using Kruskal–Wallis followed by Mann–Whitney U test (p < 0.05). * p < 0.05, ** p < 0.01, *** p < 0.001 vs. C.

