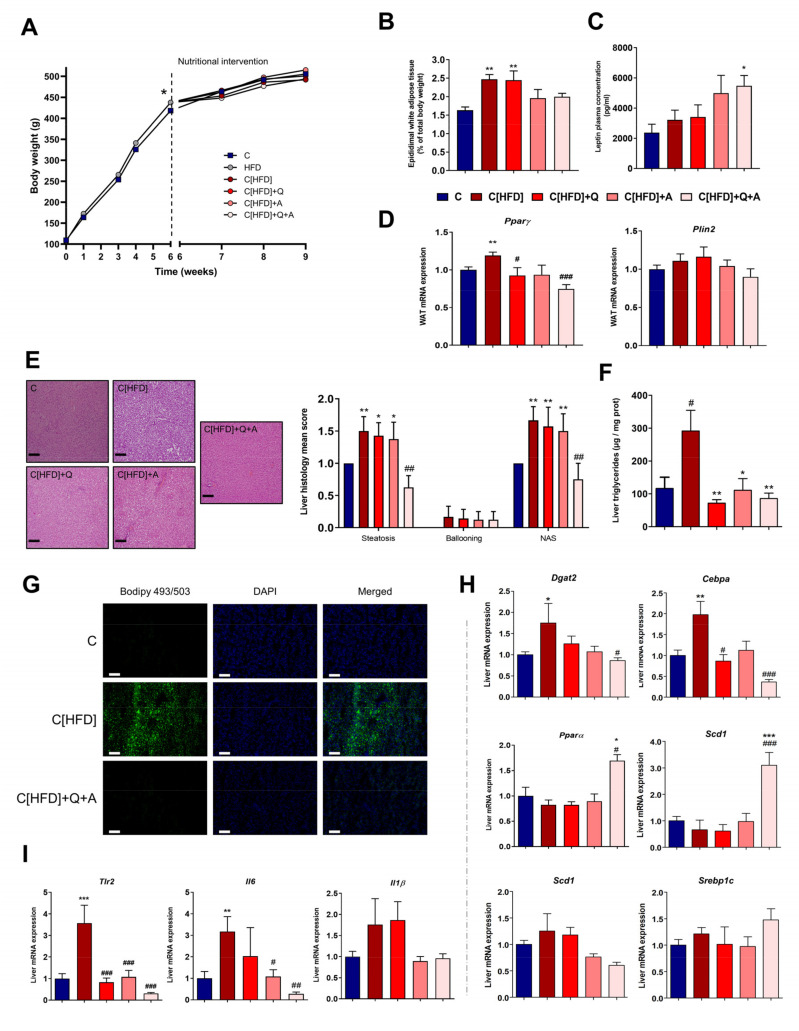
Figure 3.
Effect of diet, quercetin and A. muciniphila supplementation on obesity and NAFLD-associated histological findings and hepatic lipid metabolism. (A) Body weight gain throughout the intervention. * p < 0.05 vs. C group at 6th week. (B) Epididymal white adipose tissue content. (C) Leptin plasma concentration (pg/mL). (D) Relative mRNA expression in epidydimal white adipose tissue of genes involved in lipid accumulation (Pparγ and Plin2). (E) Representative haematoxylin and eosin stained liver sections (scale bar: 100 µm) and NAFLD activity score (NAS) (calculated from individual scores for steatosis, lobular inflammation and ballooning). (F) Hepatic triglycerides quantification (μg/mg protein). (G) Representative images of neutral lipid staining with Bodipy 493/503 (green). Nuclei were stained with DAPI (blue) and merged images of both labelling are shown. Scale bar: 100 µm. (H) Relative mRNA expression in liver tissue of genes involved in inflammation process [proinflammatory cytokines (Tlr2, Il6, Il1β)]. (I) Relative mRNA expression in liver tissue of genes involved in lipid metabolism [transcription factors (Cebpa, Pparα, Srebp1c, Srebp2), lipid synthesis (Dgat2 and Scd1)]. Bars represent mean ± SEM. * p < 0.05, ** p < 0.01, *** p < 0.001 vs. C; # p < 0.05, ## p < 0.01, ### p < 0.001 vs. C[HFD]. Statistical analysis was performed by one-way ANOVA followed by Tukey’s multiple comparison test.

