Figure 4.
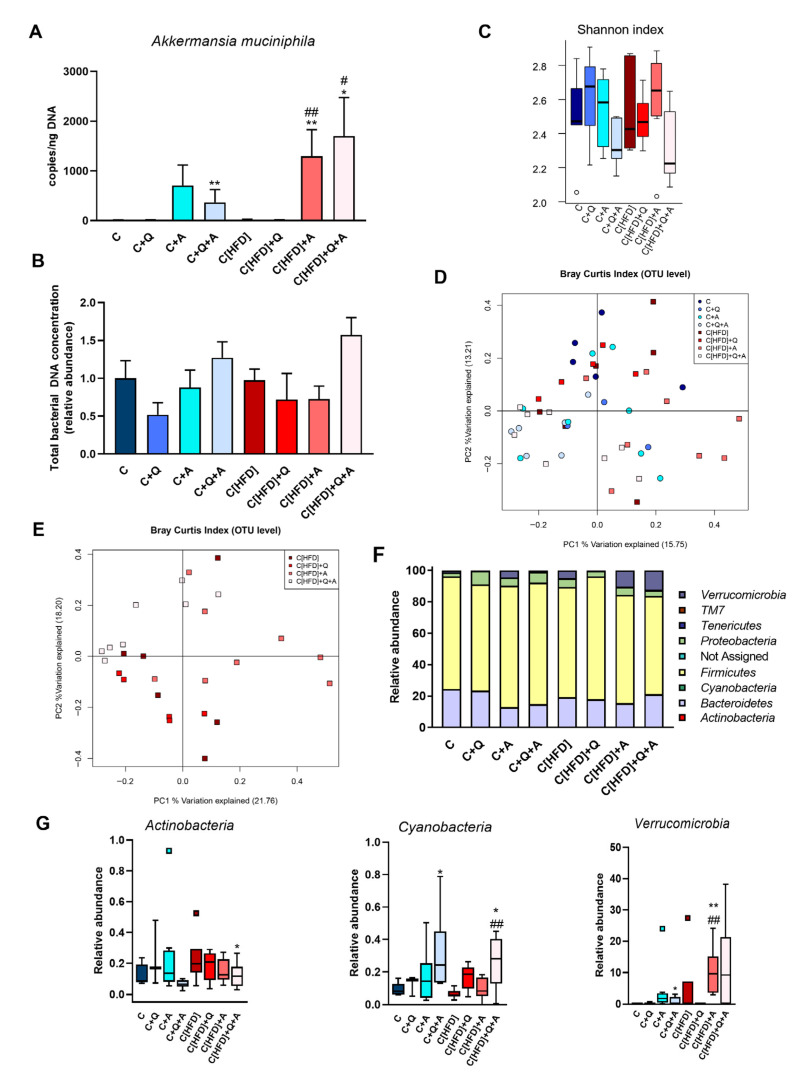
Metagenomic findings in rats after three weeks of dietary intervention, quercetin and A. muciniphila supplementation. (A) Akkermansia muciniphila quantification by qPCR. (B) Total bacterial concentration in fecal samples determined by qPCR (relative amount). (C) α-diversity measured by Shannon index at the end of the study. (D) Principal Coordinates Analysis (PCoA) plot based on Bray–Curtis dissimilarity index at OTU level considering all experimental groups. Percentage of the total variance explained is indicated in parenthesis in each axis. (E) Principal Coordinates Analysis (PCoA) plot based on Bray–Curtis dissimilarity index at OTU level in HFD fed rats subjected to dietary intervention, quercetin and A. muciniphila supplementation. Percentage of the total variance explained is indicated in parenthesis. (F) Relative abundance of the total microbial population at phylum level. (G) Differences in the relative abundance of Actinobacteria, Cyanobacteria and Verrucomicrobia phylum between C and HFD groups at 9th week. Statistical analysis was performed using Kruskal–Wallis followed by Mann–Whitney U-test (p < 0.05). * p < 0.05, ** p < 0.01 vs. C; # p < 0.05, ## p < 0.01 vs. C[HFD].

