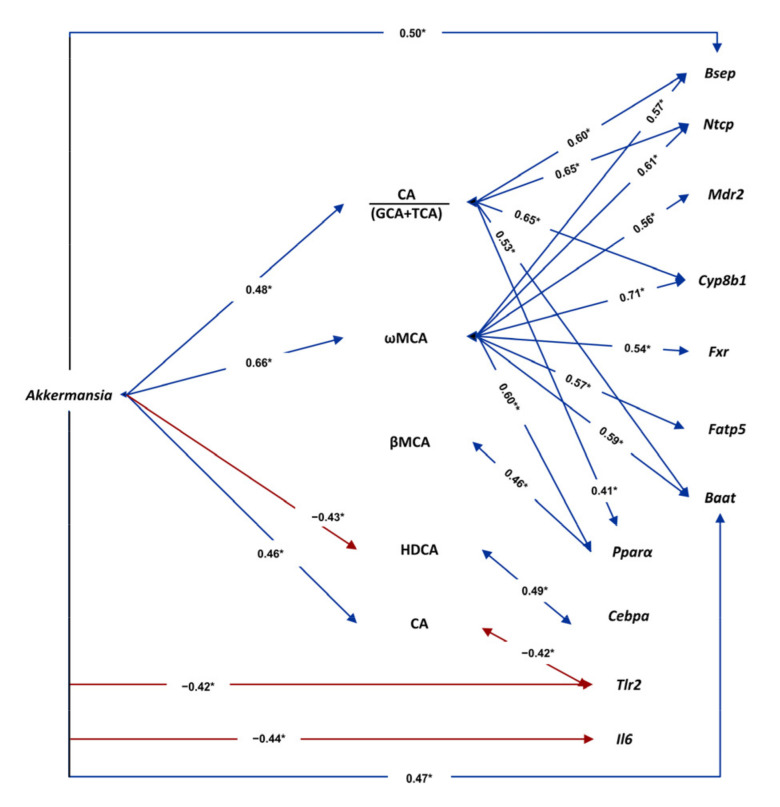
Figure 8.
Associations of gut Akkermansia genus with plasma BAs and with hepatic gene expression. The values in bidirectional arrows represent the Pearson’s correlation coefficients; * p < 0.05. Detailed XY representation of each association is provided in the Figure S3.

