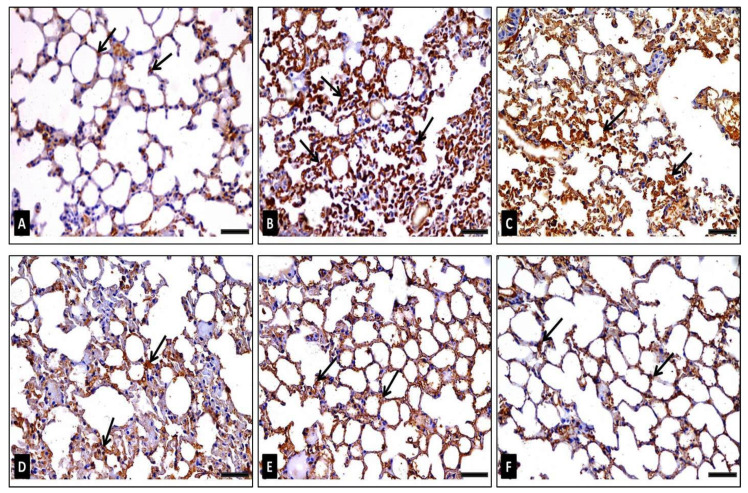
Figure 9.
Photomicrographs representing TNF-α immunoexpression in lung sections of adult male mice displaying: (A) in group I (control): few cells having weak positive immunoreaction (arrows) represented by brown cytoplasmic coloration, (B) in group II (diseased): multiple cells with a very strong positive immunoreaction (arrows), (C) in group III (diseased, 50 mg/kg FEE): multiple cells with strong positive immunoreaction (arrows), (D) in group IV (diseased, 100 mg/kg FEE): certain cells with moderate positive immunoreaction, (E) in group V (diseased, 150 mg/kg FEE): few cells with weak positive immunoreaction and (F) in group VI (150 mg/kg FEE only): few cells with weak positive immunoreaction (arrows). [TNF-α immunostaining ×400, scale bar = 50 μm].

