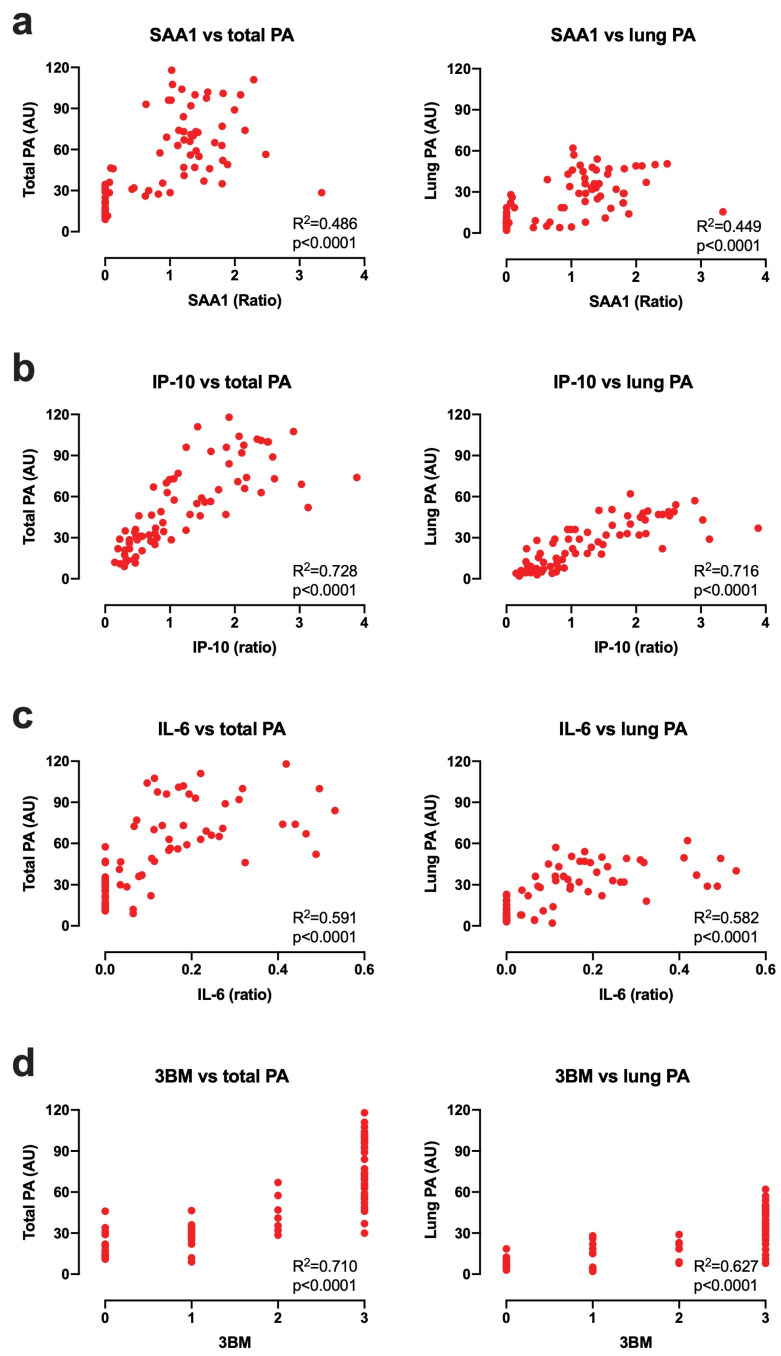
Figure 3.
Correlation between SAA1, IP-10, and IL-6 levels and total/ lung pathology score at the endpoint. (a) SAA1, (b) IP-10, and (c) IL-6 levels (x-axis) were measured by UCP-LFA in serum from MTB Erdman infected rhesus macaques (n = 75, see Figure 1). Tuberculosis pathology (PA; y-axis) scoring methods are described in Materials and Methods (2.2), and PA is expressed as arbitrary units (AU). R2 is the square of the Spearman correlation coefficient. (d) Values above the cutoff per biomarker (described in Table 1b) were considered positive. 3BM (x-axis) was generated using the sum of all positive tests results from the individual markers. (a–d) SAA1, IP-10, IL-6, and 3BM showed a good correlation with total- and lung pathology scores at the endpoint.

