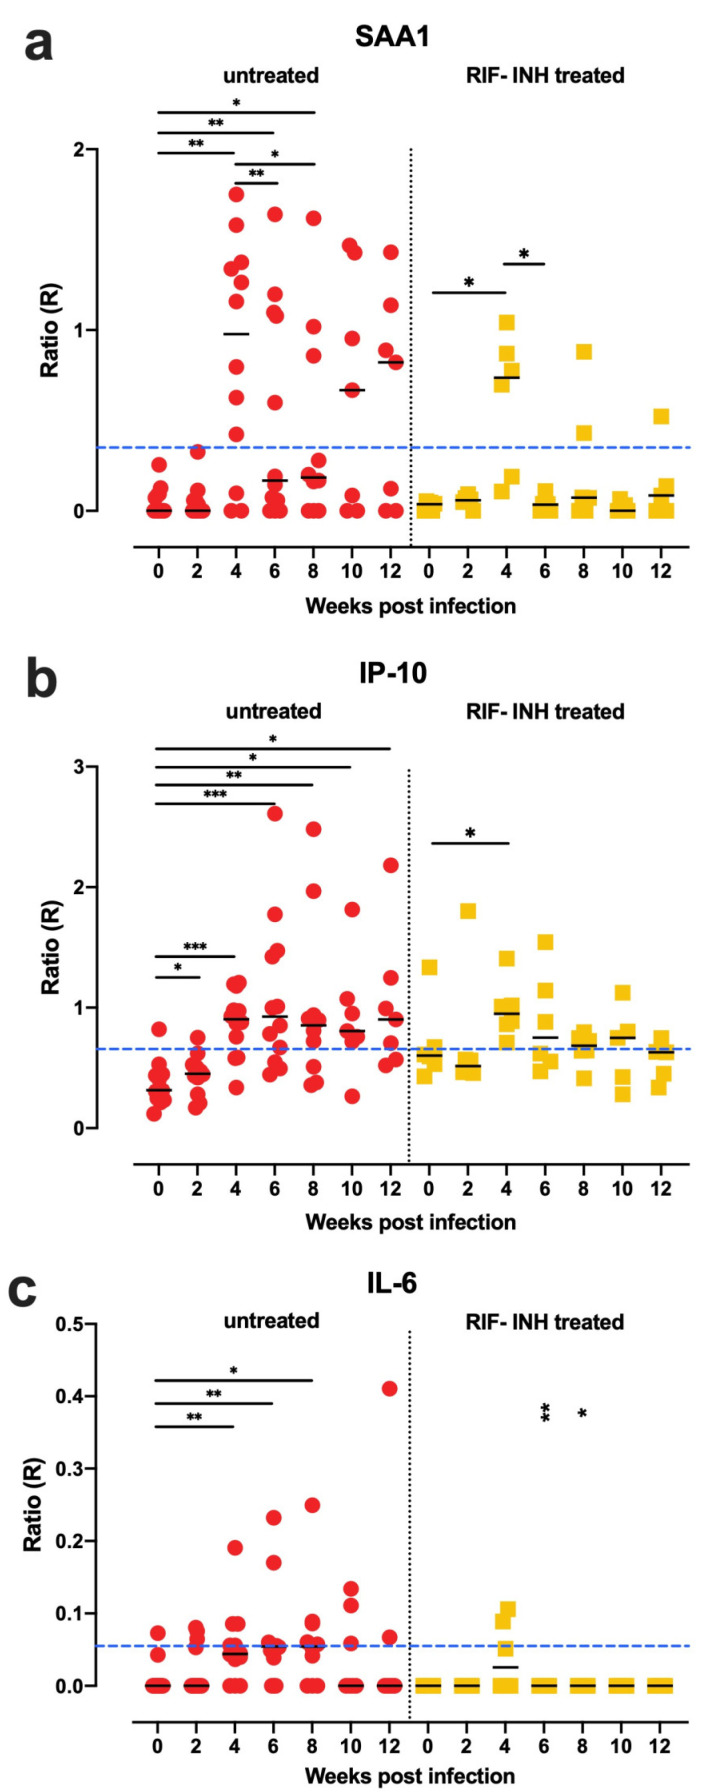
Figure 7.
SAA1, IP-10, and IL-6 decreased to the baseline levels upon antibiotic treatment. SAA1, IP-10, and IL-6 levels (y-axis) were measured by UCP-LFA in serum from low-dose (15 CFU) MTB Erdman infected rhesus macaques (n = 18), six of them were treated by rifampin (RIF) and isoniazid (INH) from week four postinfection for eight weeks until endpoint at week 12 twelve The median values of each group are indicated by horizontal lines. Red dots indicate untreated macaques; yellow squares indicate RIF + INH treated macaques. Cutoff (blue dashed lines) applied was described in Table 1b. (a–c) The SAA1, IP-10, and IL-6 levels were decreased after RIF + INH treatment. Significant differences between each timepoint versus week 0 were determined by Wilcoxon matched-pairs signed rank tests; differences between untreated versus RIF + INH treated at per time point were determined by Mann-Whitney U tests indicated in the right panel (RIF + INH). p-values: * p < 0.05, ** p < 0.01, *** p < 0.001.

