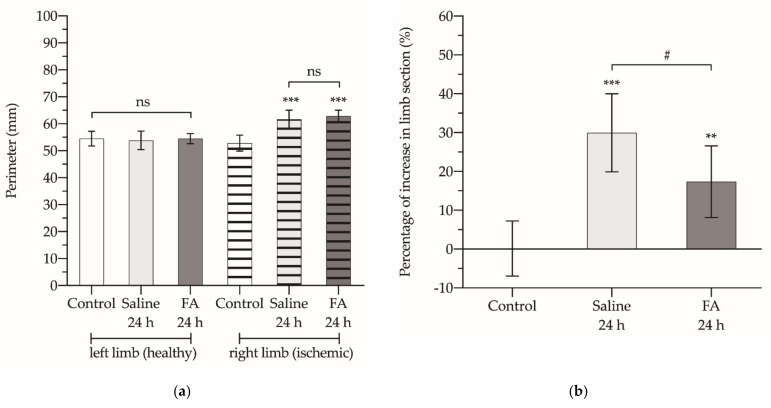
Figure 2.
Perimeter (a) and percentage of increase in the cross-sectional area of the ischemic limb with respect to the contralateral healthy limb (b). The asterisks show the statistically significant differences compared to the control (** p < 0.01; *** p < 0.001), and the pads show the statistically significant differences between the groups indicated by the upper box (# p < 0.05); ns: p > 0.05.

