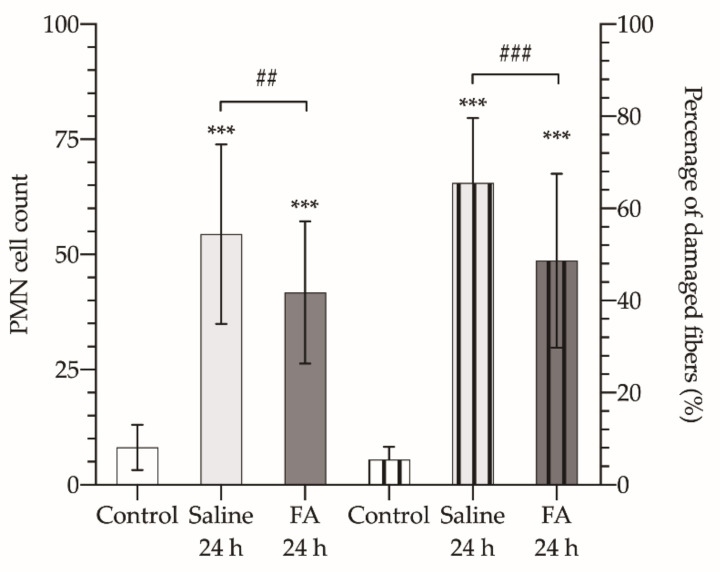
Figure 4.
Polymorphonuclear neutrophil (PMN) cell count (left axis, bars without pattern) and percentage of damaged fibers in each field at 20 × (right axis, bars with vertical striped pattern) of control healthy animals (Control, white bars), and animals undergoing 3 h of ischemia and 24 h of reperfusion and treated with saline (Saline 24 h, light gray bars), or treated with folinic acid (FA 24 h, dark gray bars). The asterisks show the statistically significant differences compared to the control (*** p < 0.001), and the pads show the statistically significant differences between the groups indicated by the upper box (## p < 0.01; ### p < 0.001); ns: p > 0.05.

