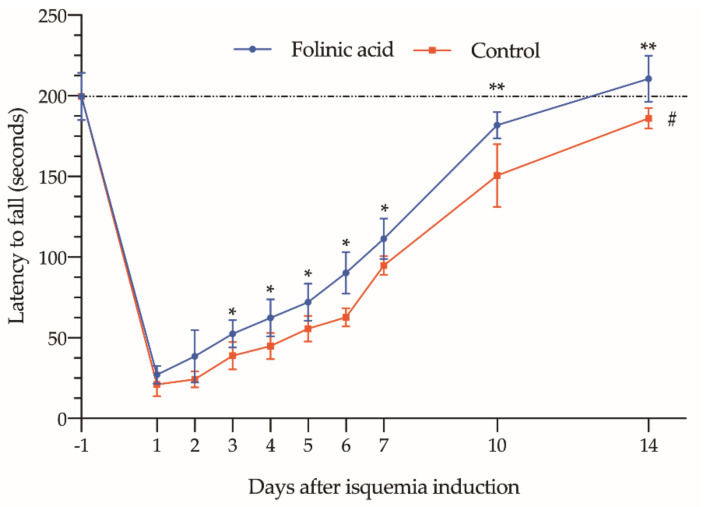
Figure 5.
Assessment of limb functional status over a 14-day period using the Rotarod test. Data show the mean and standard deviation in the fall time (expressed in seconds) of animals subjected to 3 h of ischemia period, treated with folinic acid (blue line) or with saline (red line). The asterisks show the statistically significant differences compared to the control (* p < 0.05; ** p < 0.01). The dashed red line box indicates the differences between the 14th day of the study and the baseline values determined on the day before ischemia induction (day −1) (# p < 0.05; ns: p > 0.05).

