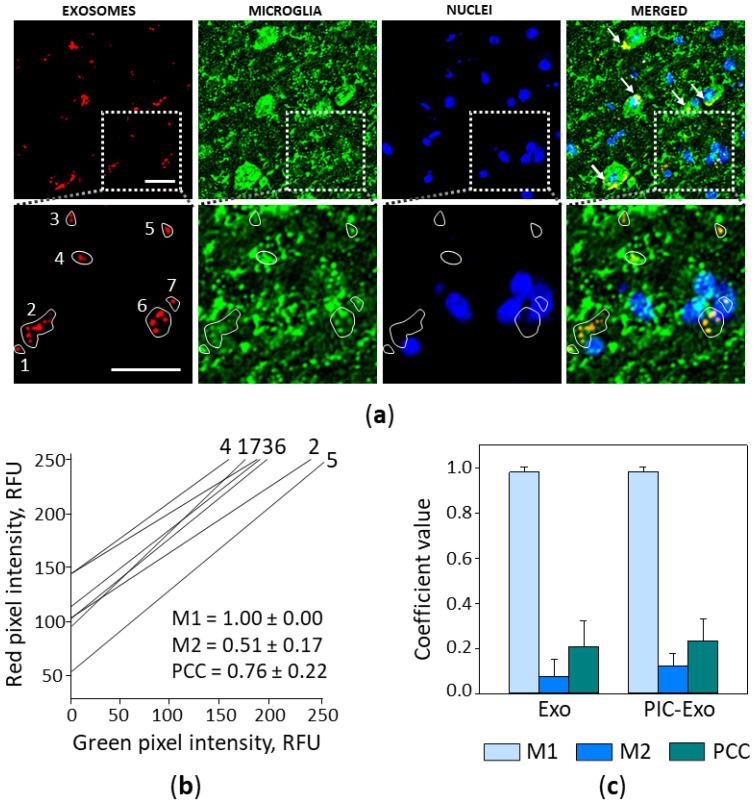
Figure 4.
Poly (I:C)-treated airway ELV internalisation by microglia in mouse brain 2 h after intranasal introduction. In (a), a representative brain slice image, where particles loaded with RNR-conjugated AF555 are red, nuclei are stained blue with DAPI, and microglial cells are green, visualised by immunostaining against TMEM119. White arrows indicate microglial cell bodies with colocalised ELVs (upper image row, MERGED), and particles colocalising with microglial processes is visible in the zoomed ROI image (lower image row). The scale bar is 20 μm. Colocalisation analysis in seven small ROIs indicated by the white lines was performed by ImageJ plugin JACoP; cytofluorograms, Mander’s and Pearson’s coefficient values are presented in (b). Results of colocalisation analysis in full-size images are shown in (c), n = 15. M1—Mander’s overlapping coefficient showing the red fluorescence fraction overlapping the green, M1—the green fraction overlapping the red; PCC—Pearson’s correlation coefficient. Exo—images of the slices from brains treated with ELVs from control airway cells; PIC-Exo—from poly (I:C)-treated airway cells.

