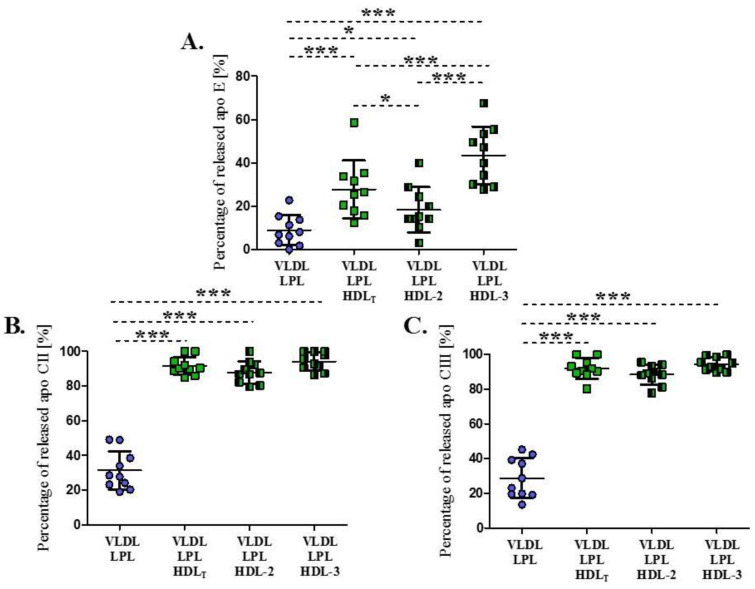
Figure 3.
Percentage of apo E (A), apo CII (B) and apo CIII (C) released from VLDL during LPL-mediated lipolysis in the absence or presence of HDLT and HDL subpopulations: HDL-2 and HDL 3. Data are presented as mean ± SD, n = 10, * p < 0.05; *** p < 0.001. Data were analyzed by Repeated Measures ANOVA with Tukey post hoc.

