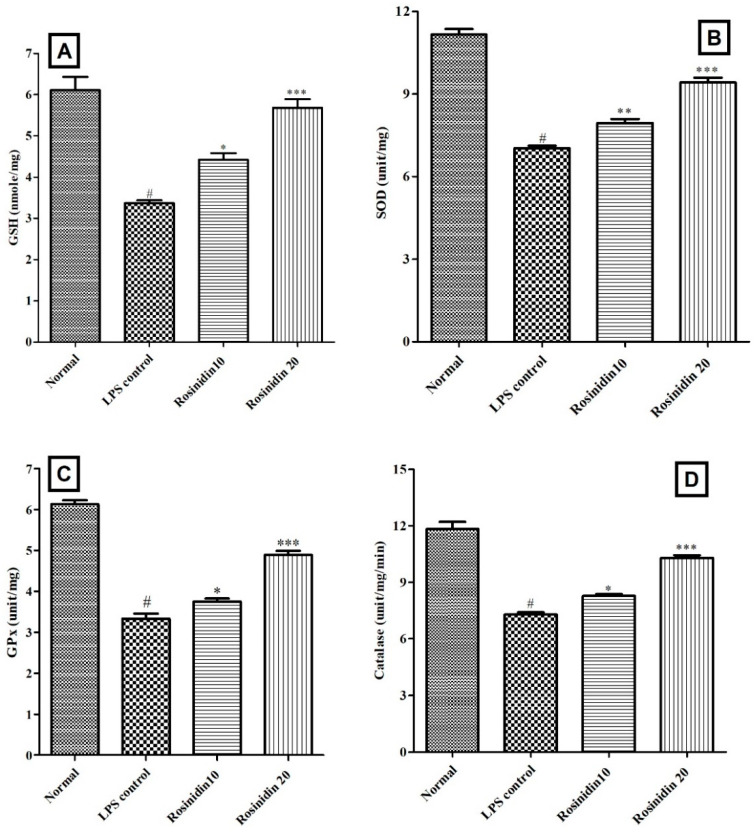
Figure 9.
Effect of rosinidin on endogenous antioxidant status in LPS-treated rats. (A) Reduced glutathione, (B) superoxide dismutase, (C) glutathione peroxidase, and (D) catalase. Values are expressed in mean ± S.E.M. (n = 6). # p < 0.05 vs. normal control rats and * p < 0.05, ** p < 0.01 and *** p < 0.001 vs. LPS control rats. One-way ANOVA followed by Tukey’s post hoc test.

