Figure 6.
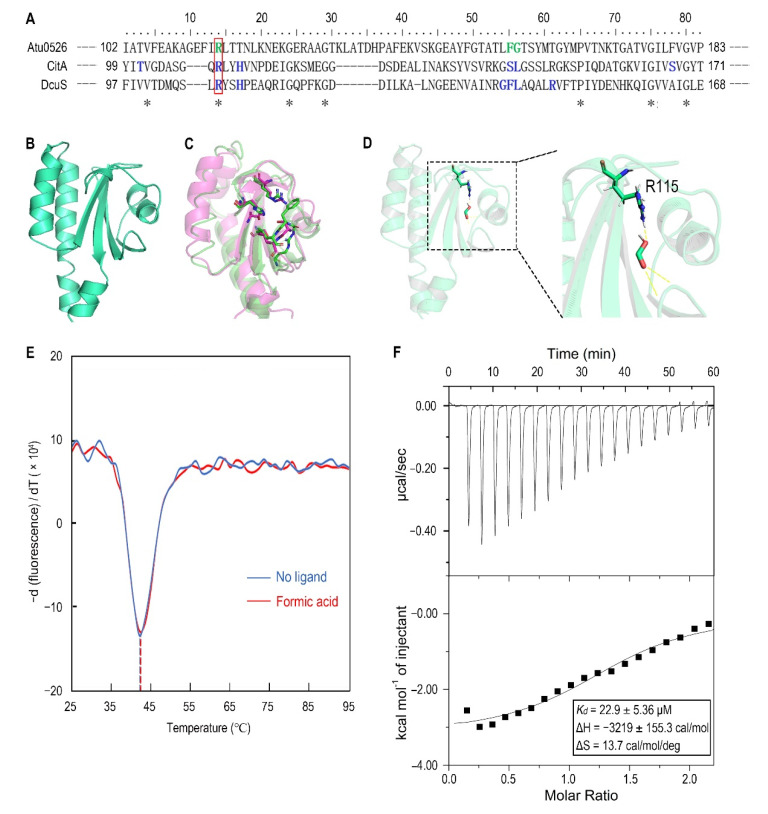
The analysis of R115 on the binding of formic acid to Atu0526LBD. (A) Sequence alignment of sCache_3_2 domains of Atu0526, CitA and DcuS. * refers to identical residues. The residues shown in blue are residues of CitA and DcuS ligand binding. The residues shown in green were predicted to bind formic acid. The red rectangle indicates R115. (B) The predicted 3D structure of sCache_3_2 domain of Atu0526. (C) The 3D structures of sCache domains from CitA (magenta, 1P0Z) and DcuS (green, 3BY8). The important residues that ligands bind to are shown in stick form. (D) The docking of formic acid with Atu0526LBD. The right part is an enlarged presentation of the content in the dashed box. The hydrogen bonds between the ligand and the protein are represented by yellow dashed lines. The R115 is in the stick diagram. (E) The binding analysis of formic acid to Atu0526LBDR115A using a thermo shift assay. The data are presented in the form of changes in the derivative of fluorescence intensity with temperature. The temperatures corresponding to the red and blue dashed lines are the Tm values of Atu0526LBDR115A with and without formic acid, respectively. (F) Isothermal titration calorimetry of Atu0526LBDR115A with formic acid. The upper panel depicts the raw titration data. The lower panel is the isotherm derived by integrating peaks from the raw data and the calculated values of Kd, ∆H and ∆S. Data points were fitted with the “one binding site model” of ORIGIN.

