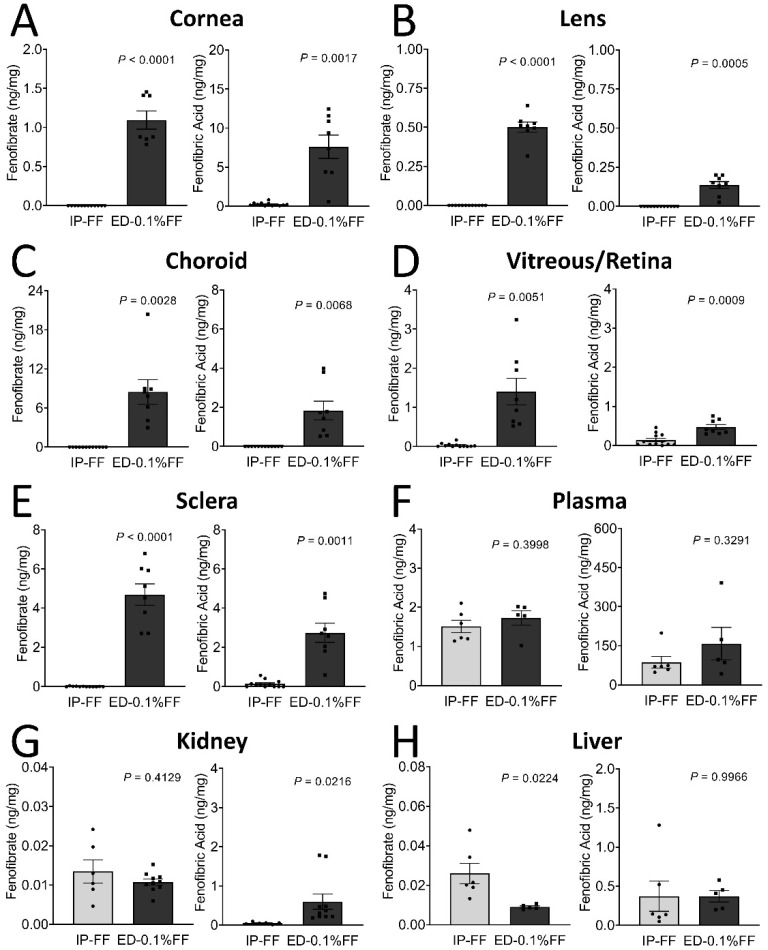
Figure 1.
The tissue distribution of fenofibrate (FF) and fenofibric acid in mice following fenofibrate intraperitoneal injection (IP) and topical application of eye drops (ED). The fenofibrate and fenofibric acid levels were determined using LC-MS in tissues as indicated. (A–H) Left graph: The tissue distribution of fenofibrate. Right graph: The tissue distribution of fenofibric acid. The data were presented as mean ± SEM, analyzed by unpaired Student’s t test, n = 5–12 eyes or organs in each group.

