Figure 4.
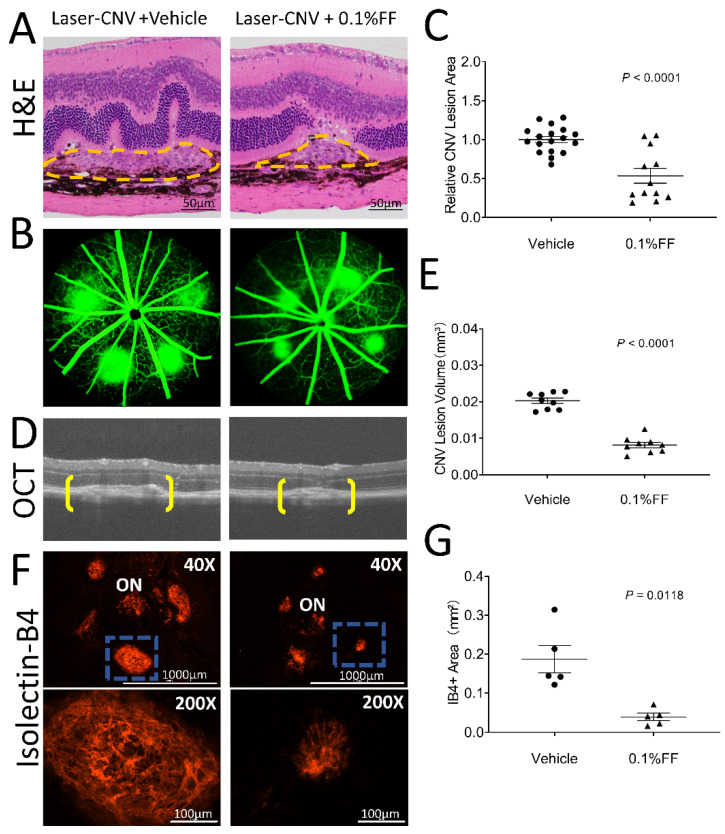
Fenofibrate eye drops suppressed laser-induced CNV. Laser-induced CNV was examined after the fenofibrate eye drop (FF) treatment for 7 days. (A) Representative section of laser-induced CNV lesion (labeled by yellow dashed lines) stained with hematoxylin and eosin. Scale bar: 50 μm. (B) Representative FFA images of the vehicle group and 0.1% FF group. (C) The percentage difference of CNV leakage was compared between the vehicle group (n = 18 animals per group) and 0.1% FF group (n = 12 animals per group). (D) Representative OCT images showing CNV (brackets). (E) Quantification of CNV lesion volumes in the vehicle group (n = 9 animals per group) and 0.1% FF group (n = 9 animals per group). (F) Representative images of flat-mounted RPE/choroid with IB4 staining (red; upper panels). Scale bar: 1000 μm. ON, optic nerve. The lower panels show higher magnification of the laser-induced CNV lesion highlighted (blue rectangle) in upper panels. Scale bar: 100 μm. (G) The area of CNV lesions was quantified in flat-mounted RPE/choroid with IB4 in the vehicle group (n = 5 animals per group) and 0.1% FF group (n = 5 animals per group). Data were expressed as mean ± SEM, analyzed by an unpaired Student’s t test.

