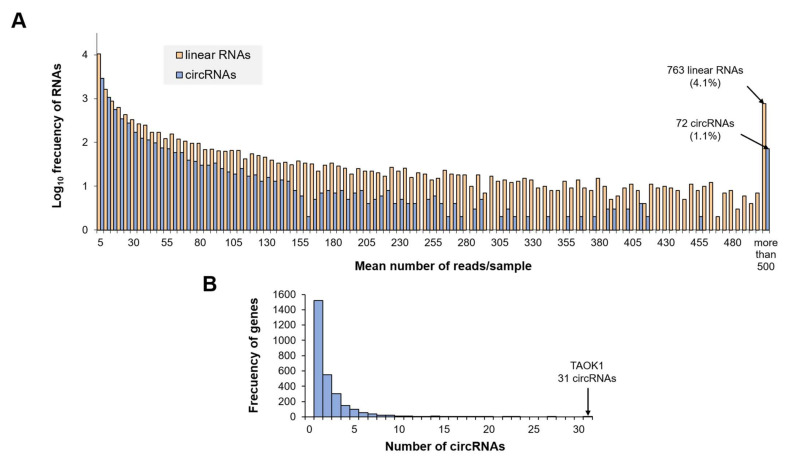
Figure 2.
General features of the transcriptome profile in Evs. (A) Histogram showing the number of reads per circular or linear transcript. For clarity, the RNA frequency has been log scaled (y axis), and for those transcripts with a mean of more than 500 reads/sample the accumulated frequency is depicted. (B) Histogram showing the number of circRNAs produced from each gene. This section may be divided by subheadings. It should provide a concise and precise description of the experimental results, their interpretation, as well as the experimental conclusions that can be drawn.

