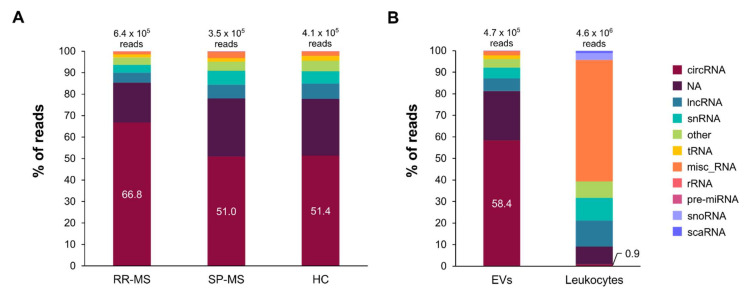
Figure 3.
Distribution of ncRNA types in the EV transcriptome profile of MS patients and controls. In order to improve the visualization of the rest of RNA types, protein-coding transcripts which represent the highest proportion have been omitted from the graph. The proportion of the different ncRNA transcript types are represented by their corresponding % out of the total ncRNA reads. The mean number of ncRNA reads for each of the conditions are shown on top of the bars. The % of circRNAs is also depicted in the corresponding portion of the bar. (A) Distribution of the ncRNA types in EVs from RR-MS, SP-MS and HCs. (B) General distribution in EVs and leukocytes. A significant difference is found for the distribution of circRNAs and miscellaneous RNAs between EVs and leukocytes (p < 0.0001).

