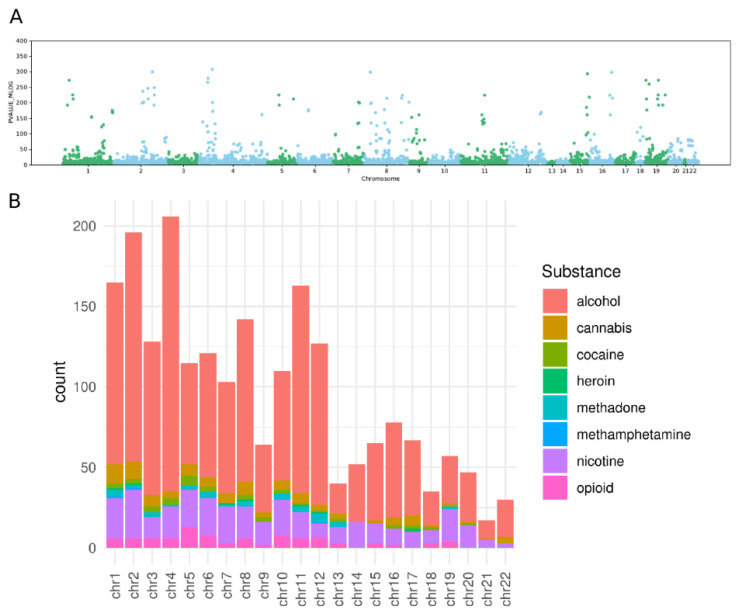
Figure 1.
(A). Manhattan plot of the SNPs associated with substances in relation to the opposite of the logarithm of their p-value (PVALUE_MLOG). From the GWAS catalog, for autosomes, SNPs with the following keywords in the column “reported trait” were extracted: opioid, alcohol, cannabis, cocaine, heroin, methadone, methamphetamine, nicotine and tobacco. We removed associations with missing reported genomic location. (B). Histogram of the count of SNPs associated with specific substances (see colour code) per chromosome. For each chromosome the number of associated markers has been stratified for each substance.

