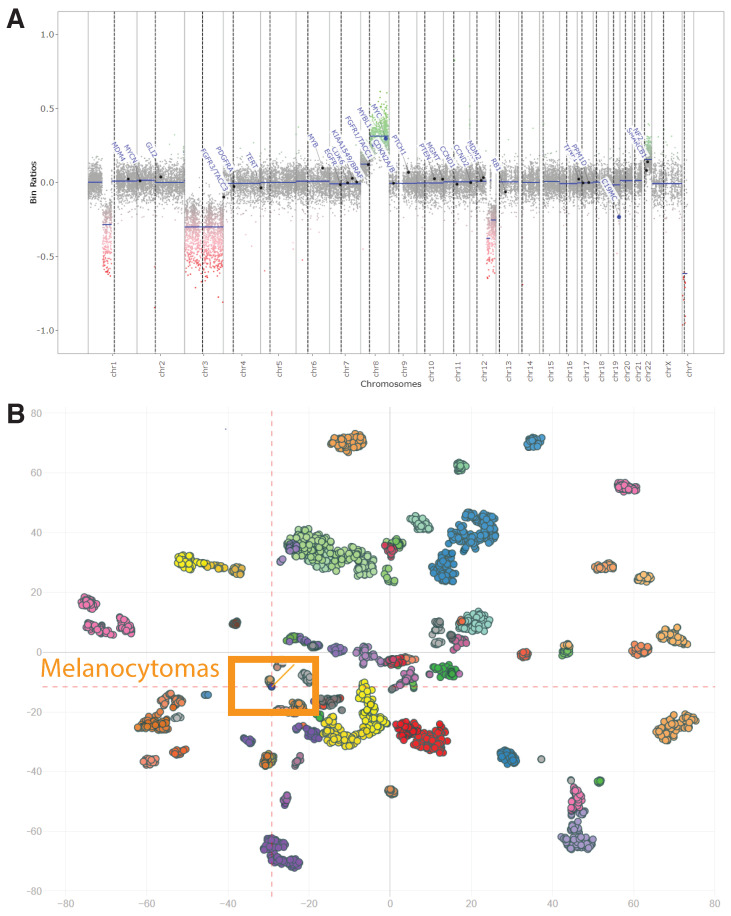
Figure 3.
Methylation profiling of the tumor. (A). Genome-wide copy number profiles determined from the Illumina Infinium HumanMethylation450 array. The x-axis represents genomic location with each dotted black line marking transition across chromosomes. The y-axis represents signal intensity. Gains represent positive, losses negative deviations from the baseline. Patient tumor demonstrating a relatively stable genome. Please note that there is whole chromosome 3 loss and whole chromosome 8 gain that do not meet the cutoffs for gains (0.5) or losses (−0.5) as per validation of the assay. (B). t-SNE visualization of methylation classifier groups. Plot of t-SNE dimensions derived from all methylation sites for all samples in the methylation classifier group and individual points represent each sample. Patient tumor (orange line) is displaying similarity with the melanocytomas group (orange box).

