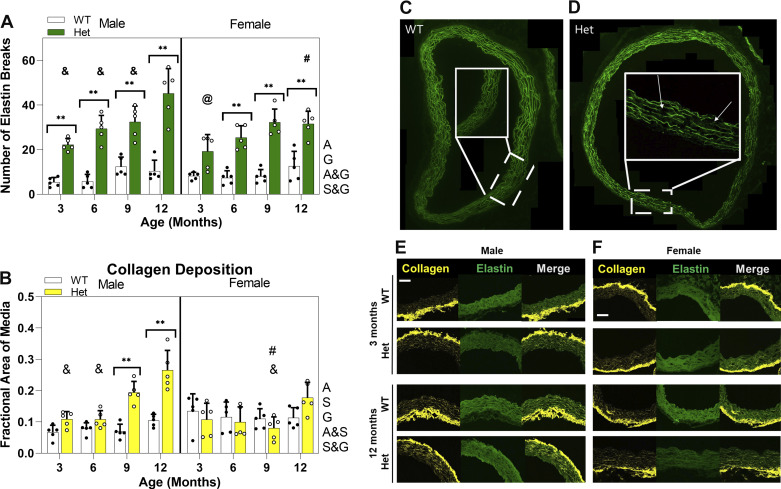
Figure 5.
Left: bar graphs showing means and standard deviation for number of elastin breaks in complete aortic ring (n = 80, 5 mice per study group) (A) and quantification of fractional area of the media positive for collagen (n = 80, 5 mice per study group) (B). White circles, Het mice; black circles, WT mice. Using three-way ANOVA and with P < 0.05, # indicates significant difference between sexes for comparable age and genotype, @ and & indicate significant difference compared with 9 and 12 mo, respectively, for same sex and genotype. ** indicates significant difference between genotypes for P < 0.01. Right: representative images showing healthy (C) and aneurysmal (D) aortic rings at 12 mo for male mice. Insets show higher magnification of part of the ring and arrows point to elastin breaks. Representative SHG images of collagen showing parts of ascending aorta of WT and Het mice at 3 and 12 mo for male (E) and female (F). Green represents autofluorescence of elastin and yellow represents collagen. All images were taken at ×200 magnification and the scale bar is 100 µm. Letters next to each graph indicates dependency and interactions. A, age; G, genotype; A&G, age and genotype; A&S, age and sex; S&G, sex and genotype; WT, wild type.

