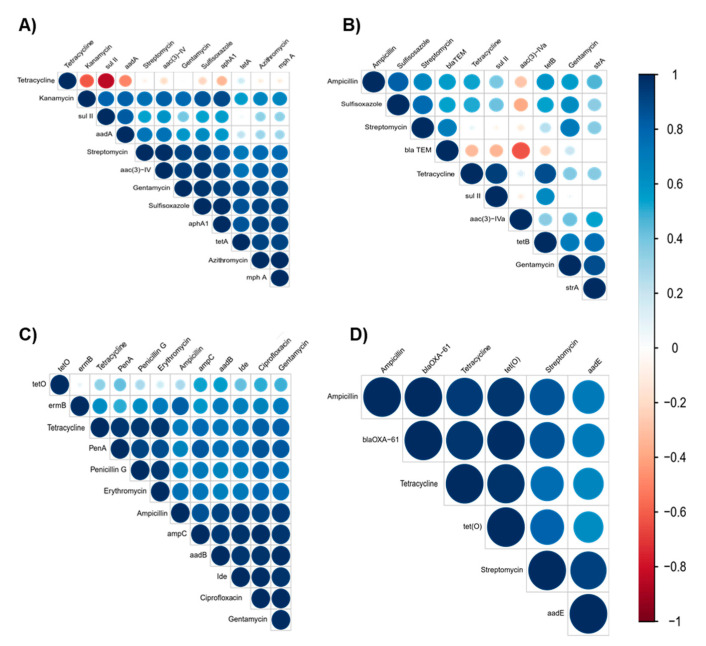
Figure 3.
Correlation matrix of phenotypic and genotypic antibiotic resistance of (A) E. coli O157, (B) Salmonella, (C) L. monocytogenes, and (D) Campylobacter. Blue is positive correlation and red is negative correlation (1 = positive correlation, 0 = no correlation, and −1 = negative correlation). Size and strength of the color represent numerical value of correlation coefficient.

