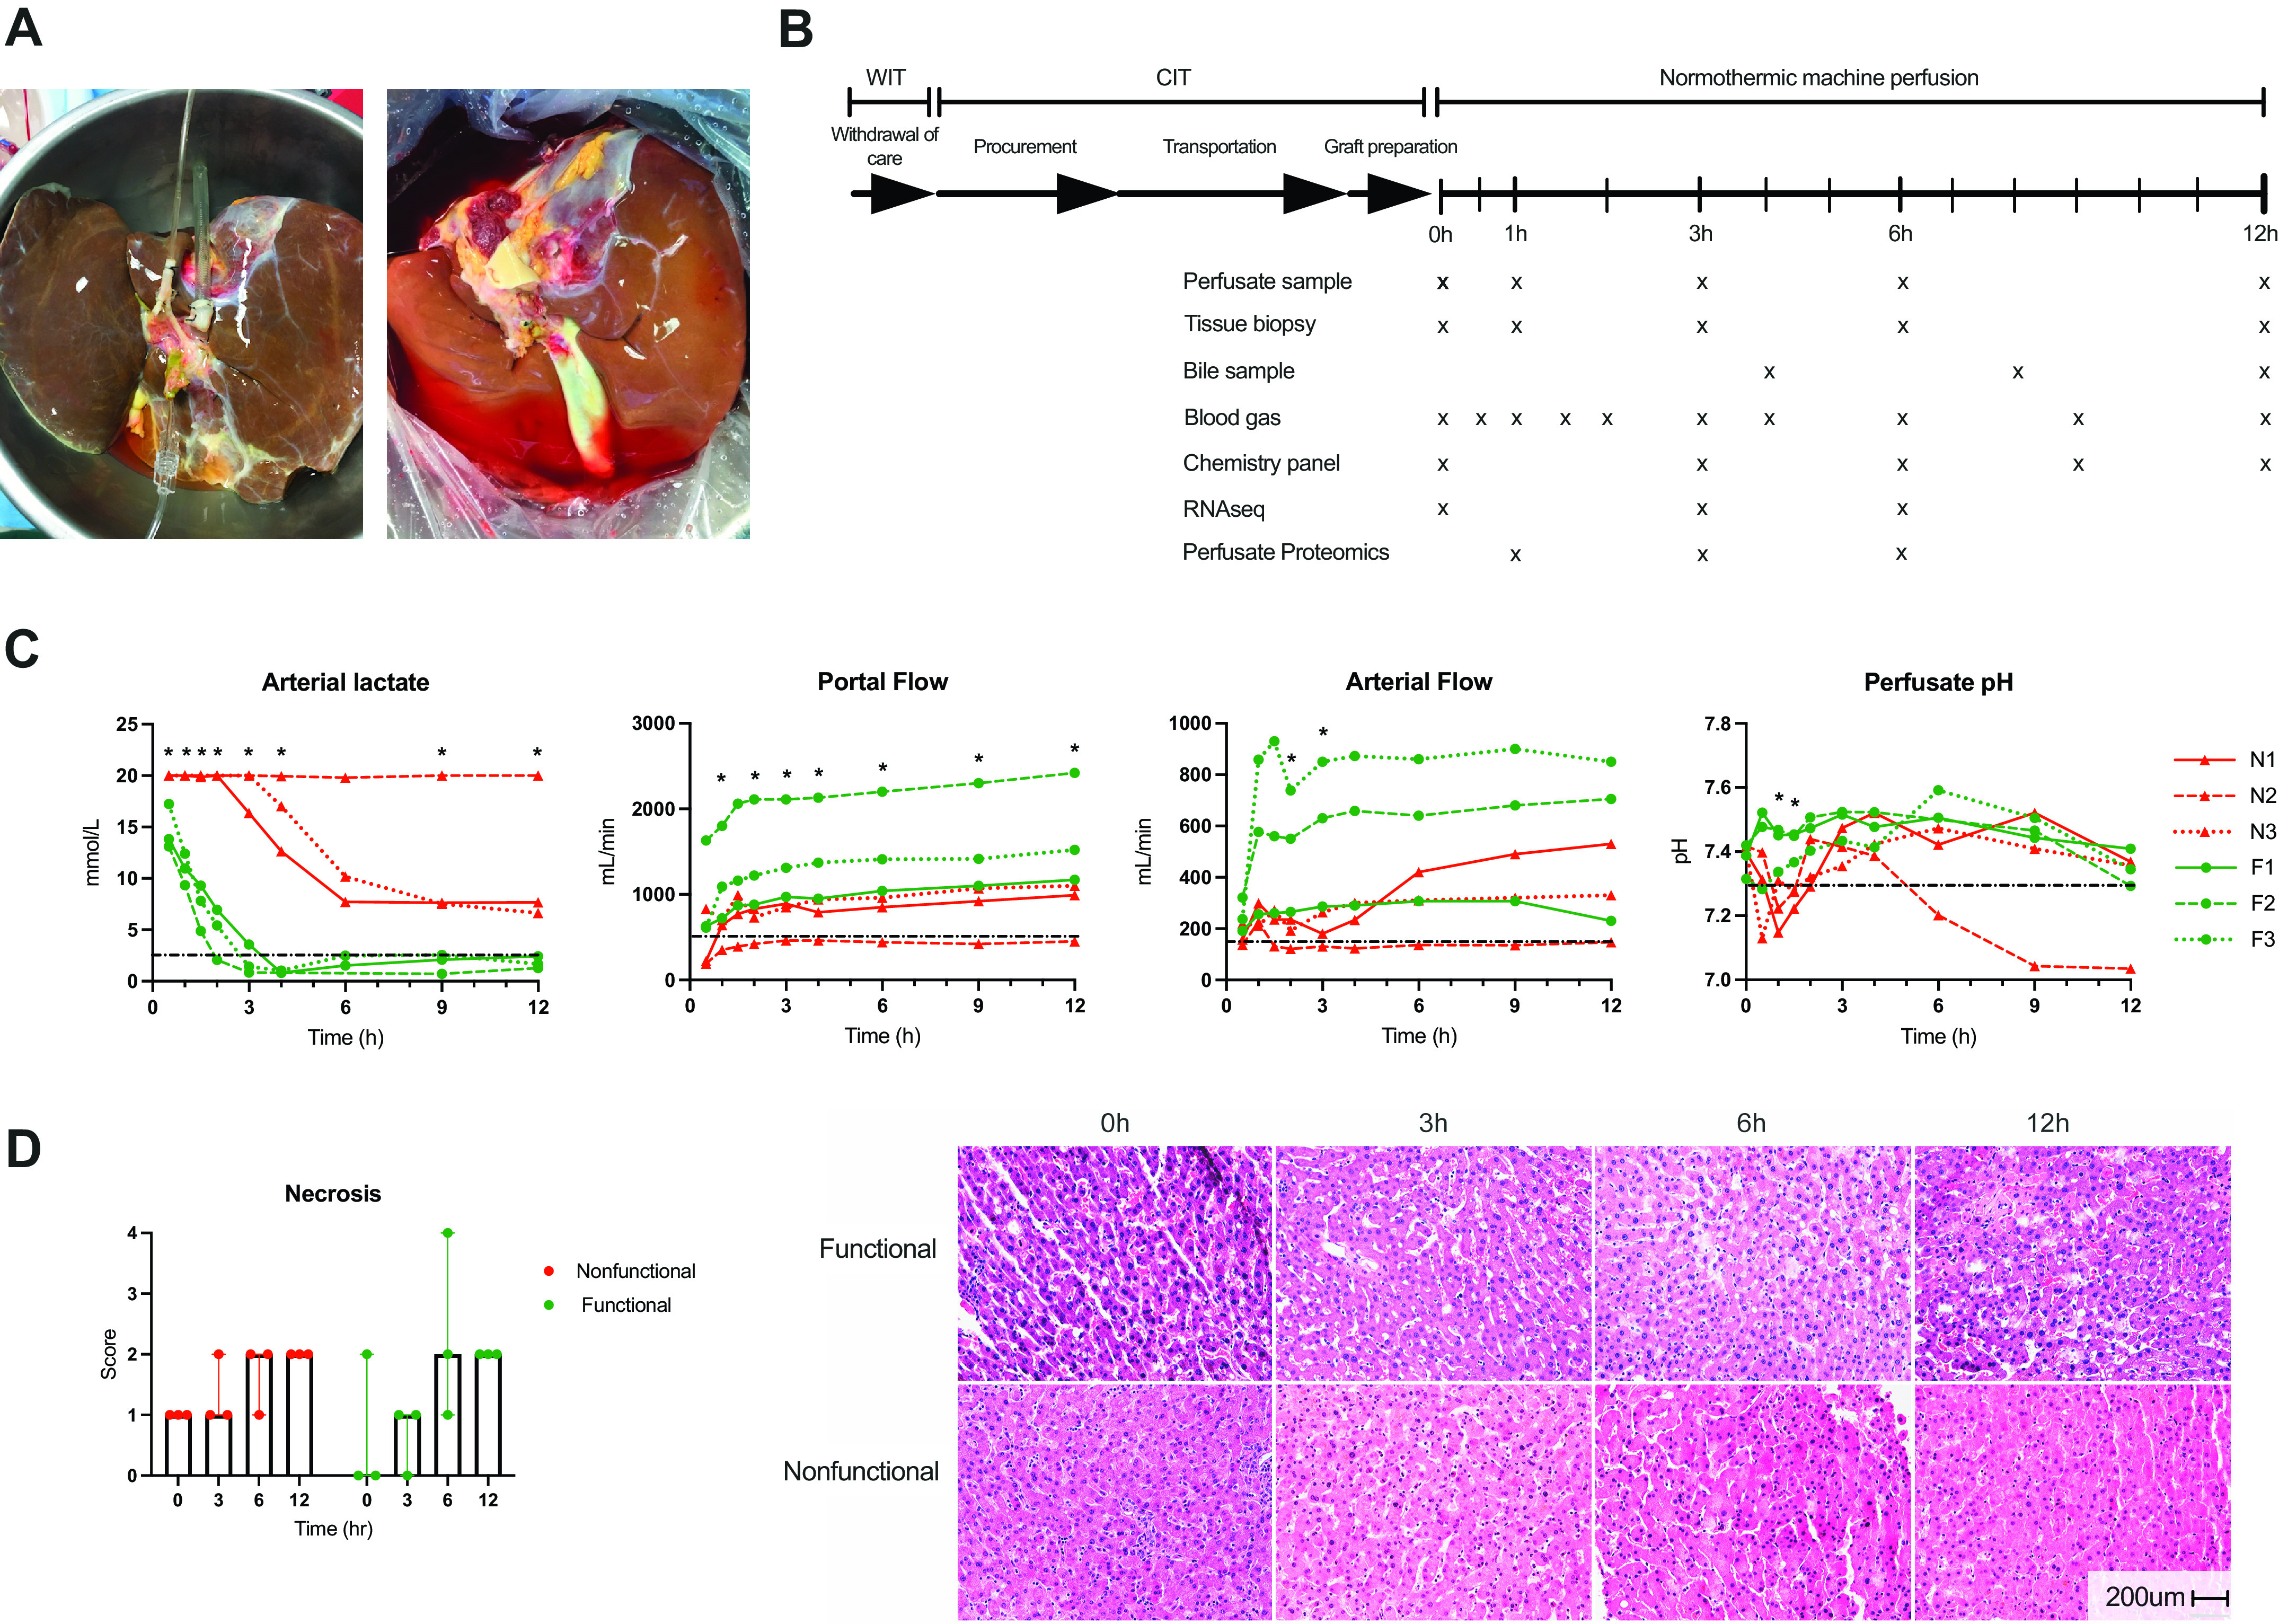
Figure 1.

Study schematic and perfusion metrics. A: representative images of two human livers being prepared for machine perfusion. B: study schematic indicating periods of warm and cold ischemia during procurement followed by normothermic machine perfusion. Data and sample collection time points are indicated by “x” under the perfusion time bar. C: criteria used to determine hepatocellular function are shown for individual livers (red: nonfunctional, green: functional). Functional livers are primarily characterized by the ability to clear lactate below the 2.5 mmol/L threshold. Dotted black line indicates criteria thresholds. *P < 0.05 for group comparison at indicated time point. Lactate assay upper limit is 20 mmol/L. D: hepatocellular necrosis scores at individual time points demonstrate no significant difference between groups. Representative H&E images of functional and nonfunctional livers are shown. Scale bar: 200 microns. CIT, cold ischemic time; H&E, hematoxylin and eosin; F, functional liver; N, nonfunctional liver; WIT, warm ischemic time.
