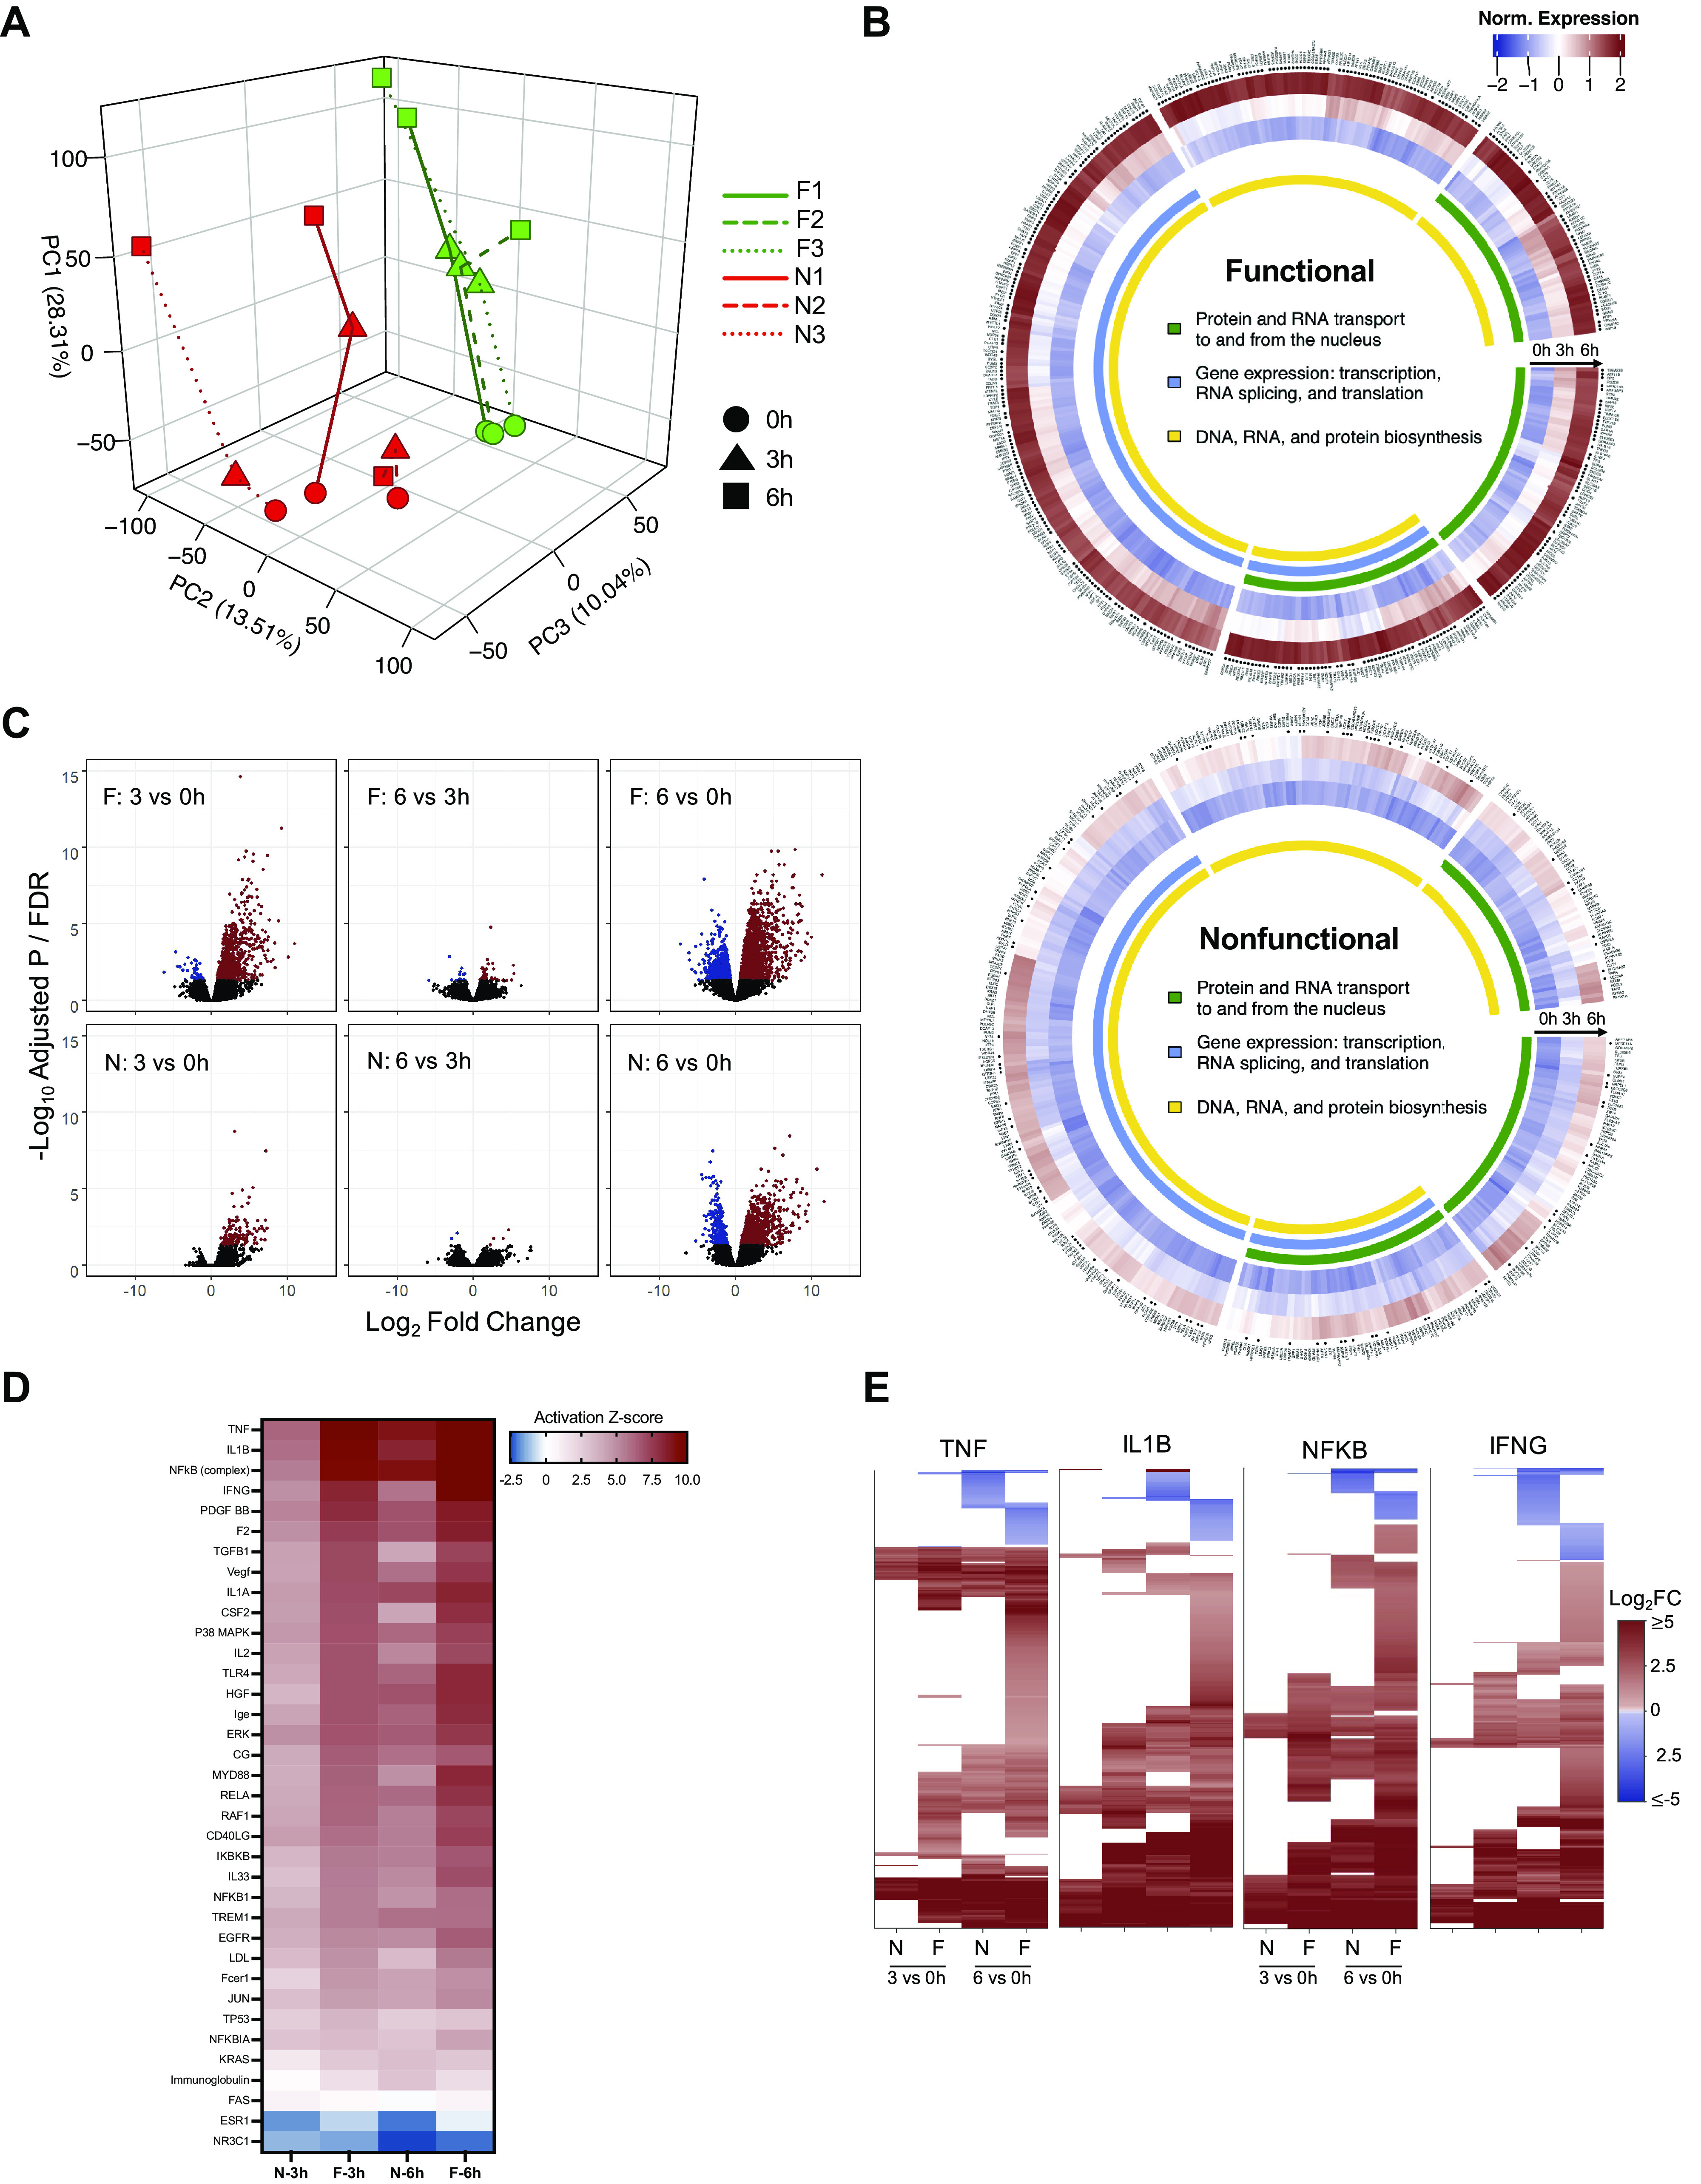
Figure 2.

Comparison of differential gene expression patterns in functional and nonfunctional livers. A: three-dimensional (3-D) PCA plot demonstrates clustering of individual livers at 0, 3, and 6 h of perfusion (red: nonfunctional, green: functional). B: circular heatmaps for each group represent the top 10% of genes accounting for the variance in PC1. *FDR < 0.05 for either 3 h vs. 0 h or 6 h vs. 0 h comparison. C: volcano plots (FDR vs. fold change) comparing gene expression between time points in functional and nonfunctional livers. Genes meeting the FDR cutoff <0.05 are shown in red (upregulated) and blue (downregulated); nonsignificant genes are shown in black. D: activation Z-scores of the top significant (P < 10−14) upstream regulators from IPA enriched in both functional and nonfunctional groups at 3 and 6 h relative to preperfusion (0 h). E: heatmaps show differential expression of downstream gene targets for the top four upstream regulators (log2FC shown for 3 h vs. 0 h and 6 h vs. 0 h comparisons, FDR cutoff <0.05); nonsignificant expression indicated by white space). F, functional livers; FDR, false discovery rate; IPA, ingenuity pathway analysis; N, nonfunctional livers; PC1, principal component 1; TNF, tumor necrosis factor; IL1β, interleukin 1β; NF-κB, nuclear factor-κβ subunit; IFNγ, interferon γ.
