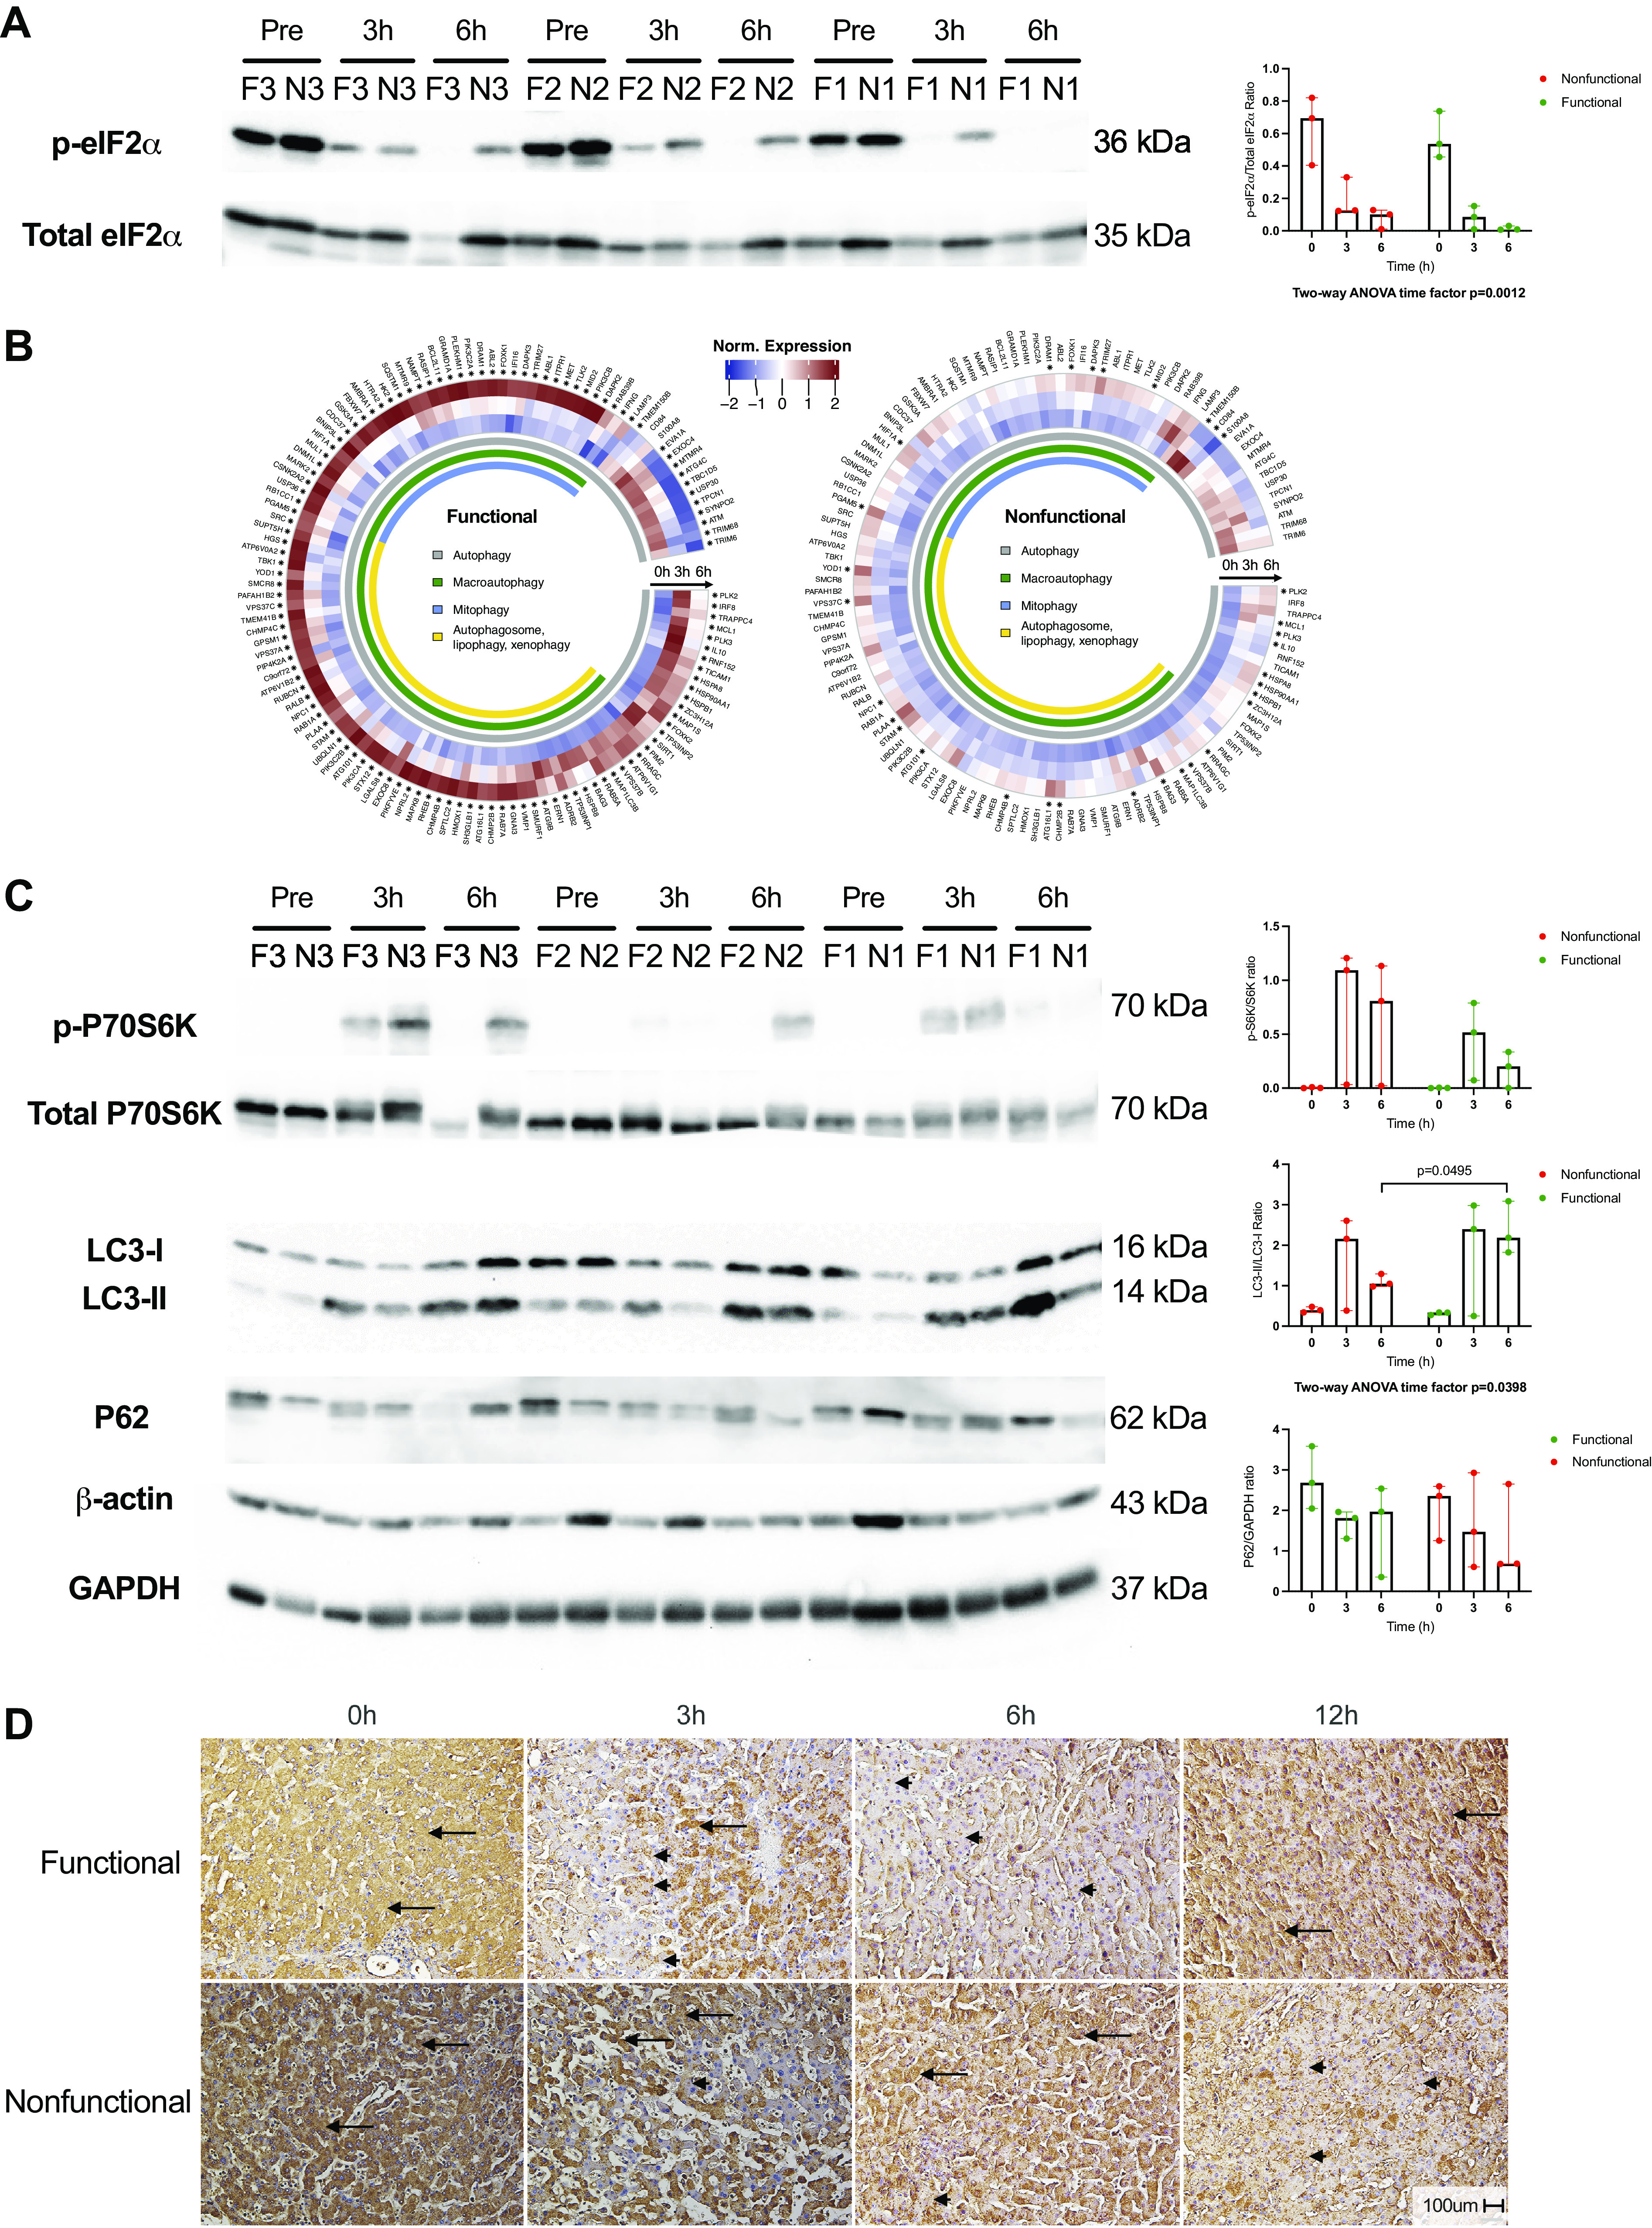
Figure 4.

Activation of autophagy in response to injury and stress during NMP. A: Western blot of phosphorylated and total eIF2α with densitometry ratios. B: circular heatmaps demonstrating differential expression of genes associated with the GO term “autophagy” in functional and nonfunctional livers. Asterisk (*) next to gene names indicates FDR < 0.05 for either 3 h vs. 0 h or 6 h vs. 0 h comparison. C: phospho-/total P70S6K, LC3-I/-II, and P62 Western blots for both groups with densitometry ratios. β-Actin and GAPDH levels are shown as control and demonstrate variability between human livers. D: representative images of LC3 immunohistochemistry shown for both groups. Scale bar: 100 µm. eIF2α, eukaryotic initiation factor 2α; FDR, false discovery rate; F, functional livers (green); GO, gene ontology; LC3-I/-II, light chain 3-I/II; N, nonfunctional livers (red); NMP, normothermic machine perfusion.
