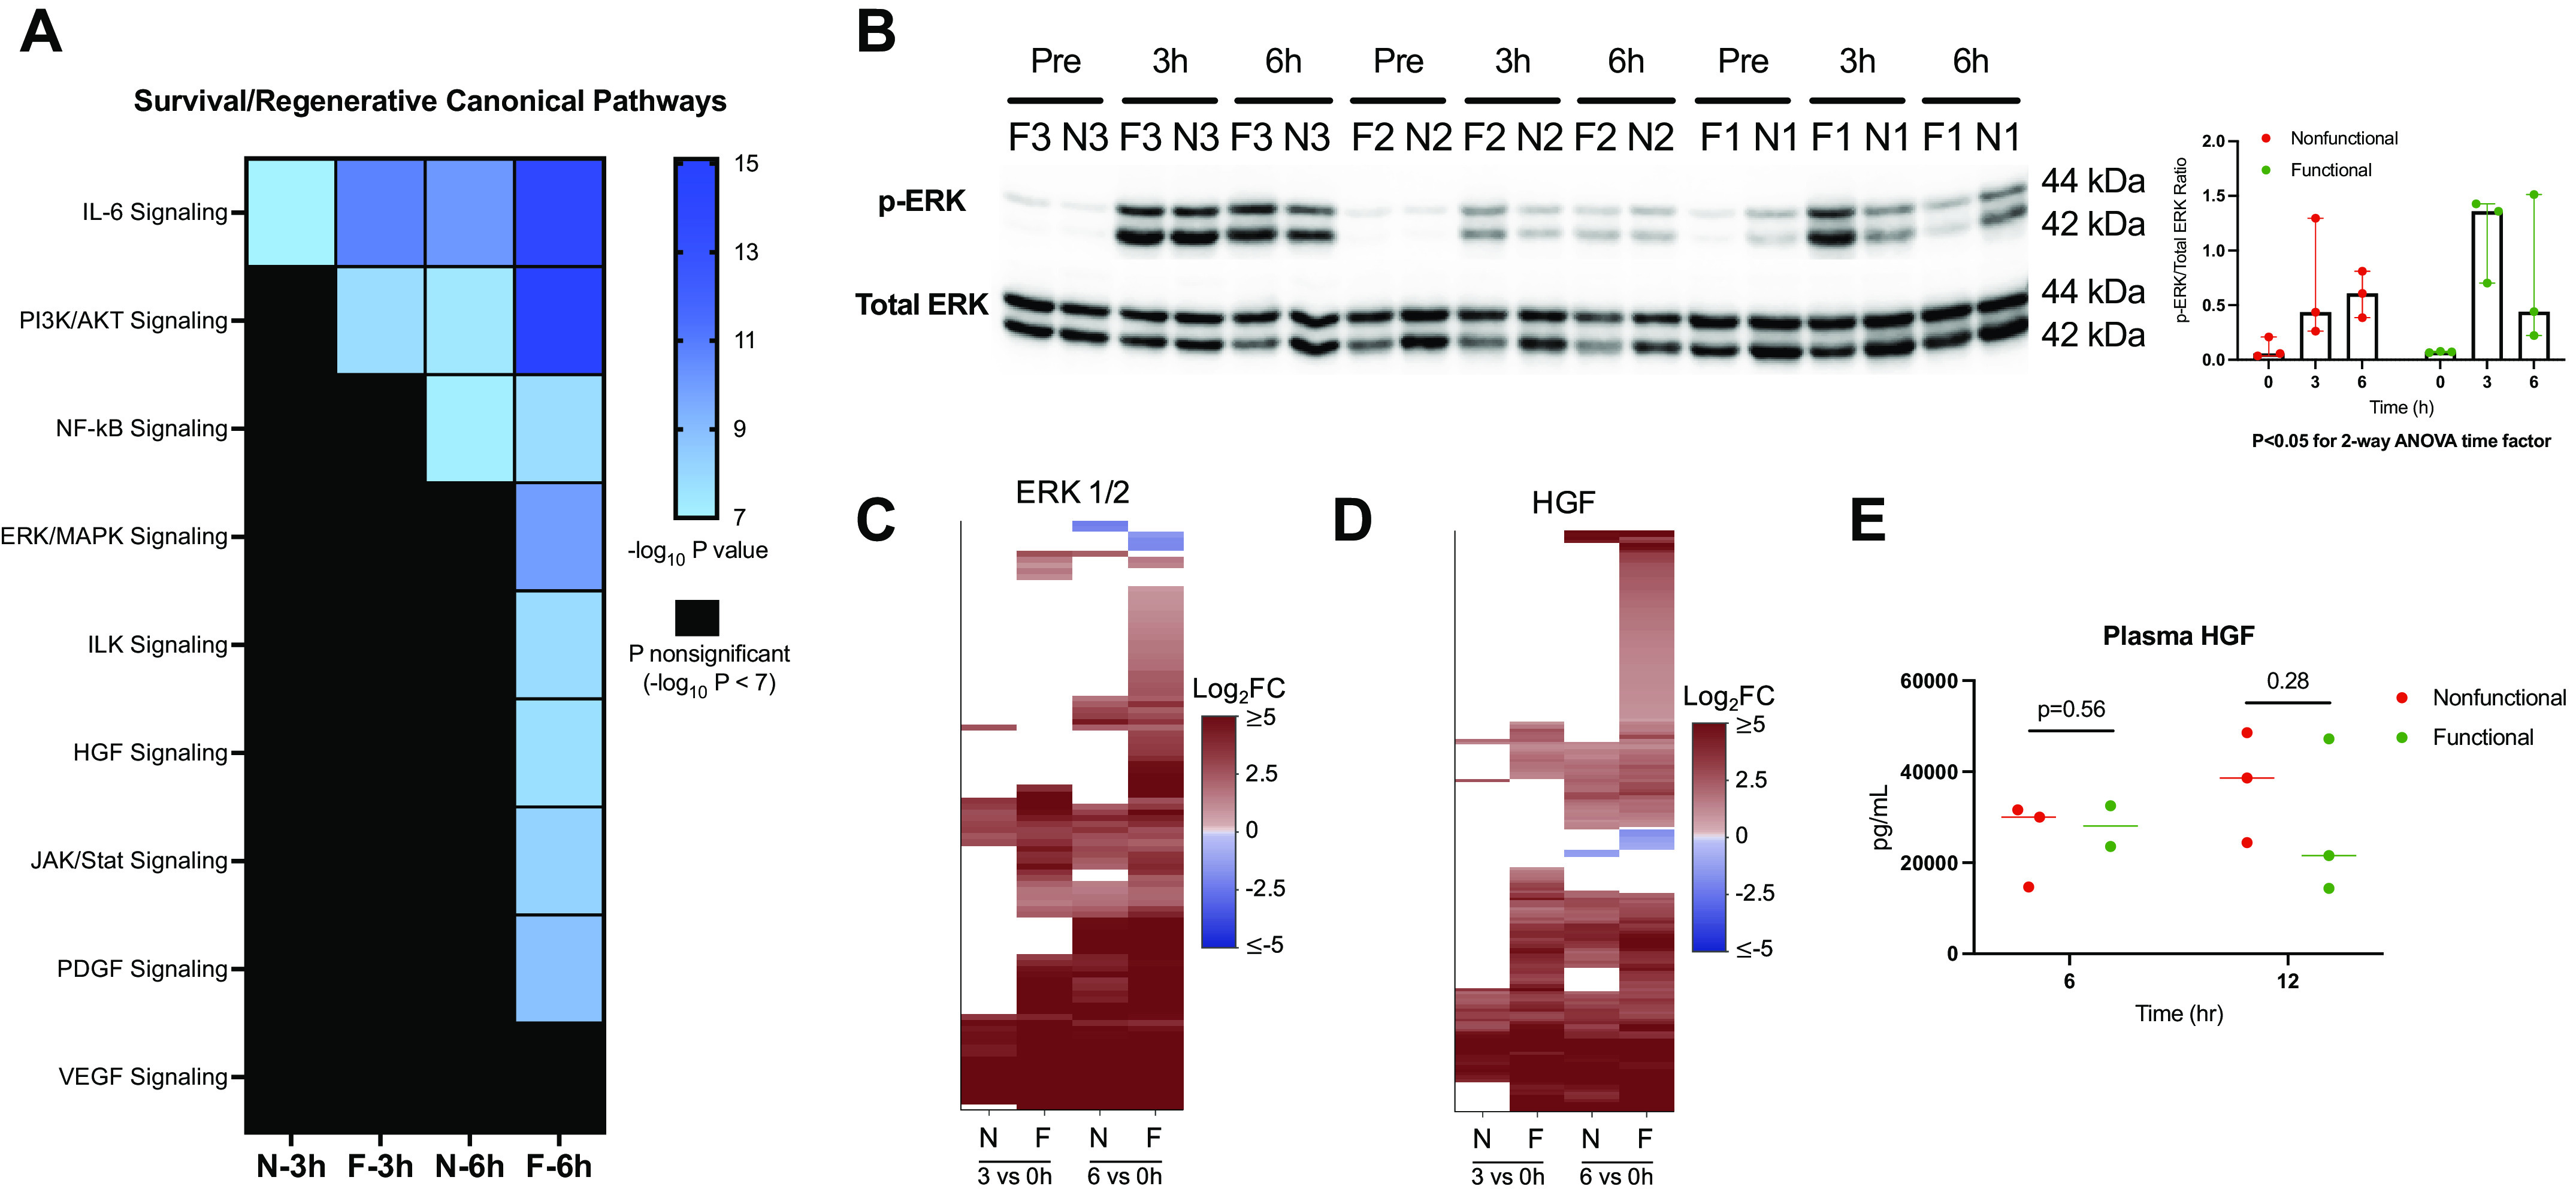
Figure 5.

Prosurvival and regenerative signaling during NMP. A: heatmap displays enrichment of canonical pathways related to prosurvival and regenerative signaling derived from IPA. The significance threshold was set to −log10 P value > 7 for comparison of 3- and 6-h gene sets to the preperfusion (0 h) baseline for each group. B: Western blot of phosphorylated and total ERK (top) with densitometry ratios (bottom). C: heatmap displaying differential expression of downstream ERK targets in functional and nonfunctional livers (log2FC shown for 3 h vs. 0 h and 6 h vs. 0 h comparisons, FDR cutoff <0.05); nonsignificant expression indicated by white space). Target list derived from upstream regulator analysis in IPA. D: perfusate concentration of HGF in both groups after 6 and 12 h of NMP. Liver F2 6-h perfusate sample not available. E: heatmap of downstream gene target differential expression for HGF. F, functional livers; FDR, false discovery rate; HGF, hepatocyte growth factor; IPA, ingenuity pathway analysis; JAK/STAT, Janus kinase/signal transducer and activator of transcription; log2 FC, log2 fold change; N, nonfunctional livers; NF-κB, nuclear factor-κβ subunit; NMP, normothermic machine perfusion.
