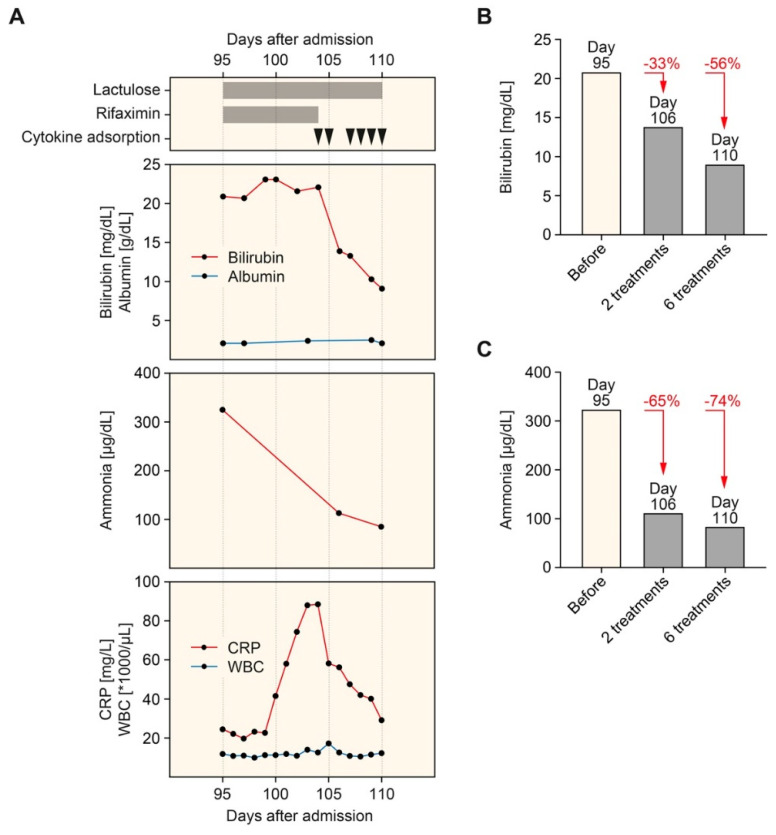
Figure 2.
Timeline of hemadsorption therapy. (A) Arrowheads indicate the time points of hemadsorption. Plasma levels of bilirubin, albumin (upper panel), ammonia (middle panel), CRP, and WBC count (lower panel) are shown. (B) Levels of bilirubin before (95 days after admission) and after the initiation of hemadsorption therapy (106 and 110 days after admission). (C) Levels of ammonia before (95 days after admission) and after the initiation of hemadsorption therapy (106 and 110 days after admission). Abbreviations: CRP, C-reactive protein; WBC, white blood cell.

