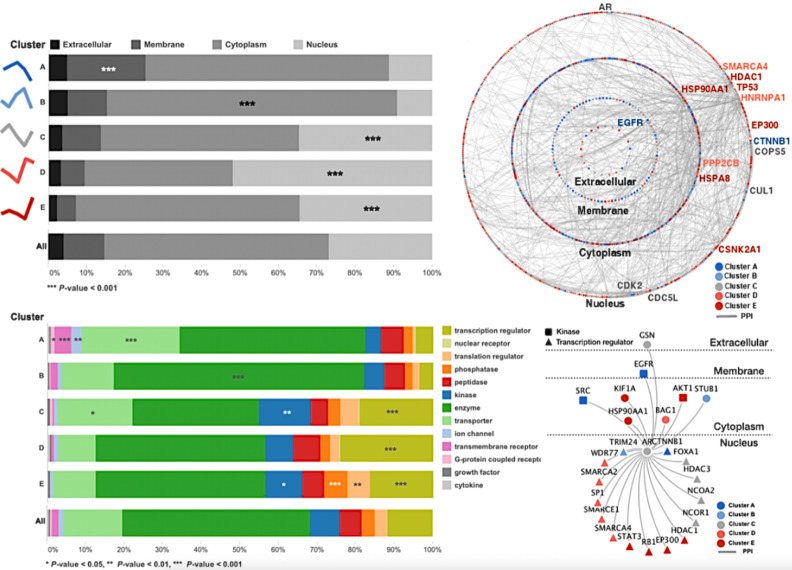
Figure 3.
Androgen-response profiles correlate with the subcellular localization of the proteins. (A) Relative proportions of protein localization for each cluster show that cluster A is enhanced for plasma membrane proteins (hypergeometric p-value < 0.001), whereas its up-regulated counterpart cluster, E, is enhanced for nuclear proteins. The clusters are ordered according to their proportions of plasma membrane proteins. (B) The spectra of protein types for each cluster show that the type-enrichment patterns are associated with the androgen-response profile. Clusters of proteins that change in different directions (e.g., A,E) show mutually exclusive enrichment patterns. (C) All clustered proteins are laid out in circles according to their cellular compartments and are colored by their clusters. The down-regulated proteins (A,B) are enriched for plasma membrane proteins (blue), whereas the up-regulated proteins (D,E) are enriched for nuclear proteins (red). The oscillating proteins do not show any bias for a given compartment. The hub protein, EGFR, directly interacts with AR and with various downstream proteins in different cellular compartments. (D) Neighboring proteins of AR in the high-confidence protein–protein interaction network are presented (1st and 2nd only).

