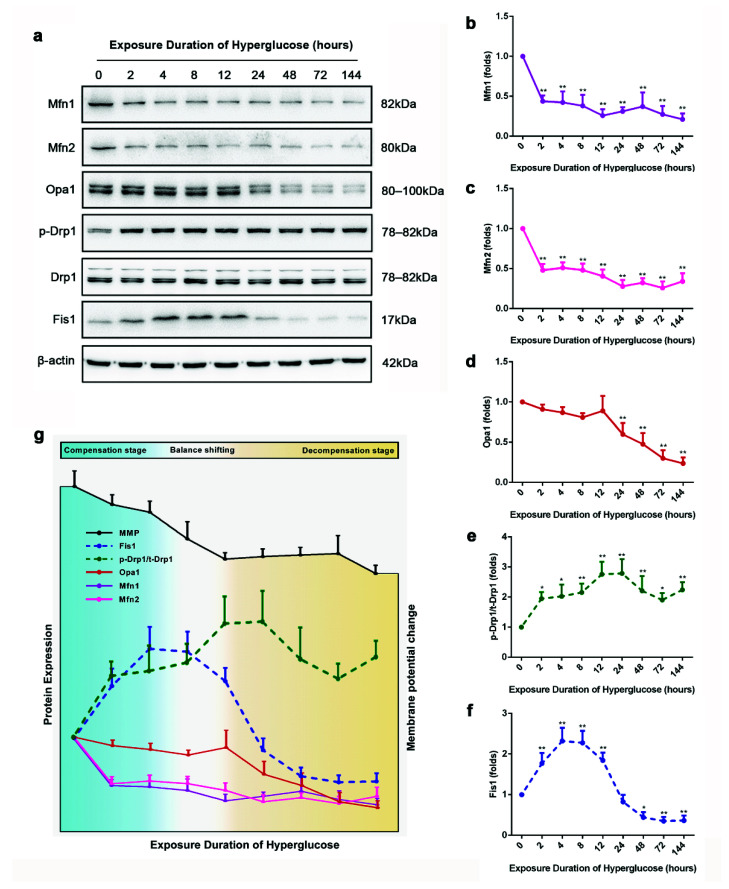
Figure 2.
The three stages of mitochondrial fusion/fission balance during high-glucose-induced vascular injury. (a–f) Expression levels of mitochondrial fusion/fission proteins. (g) Summary of the sustained effects of different high-glucose exposure times on MMP, expression of mitochondrial dynamic proteins, and cellular apoptosis assay. Data are expressed as the mean ± SEM. n = 3 for each group. * p < 0.05, ** p < 0.01 vs. the normal-glucose group.

