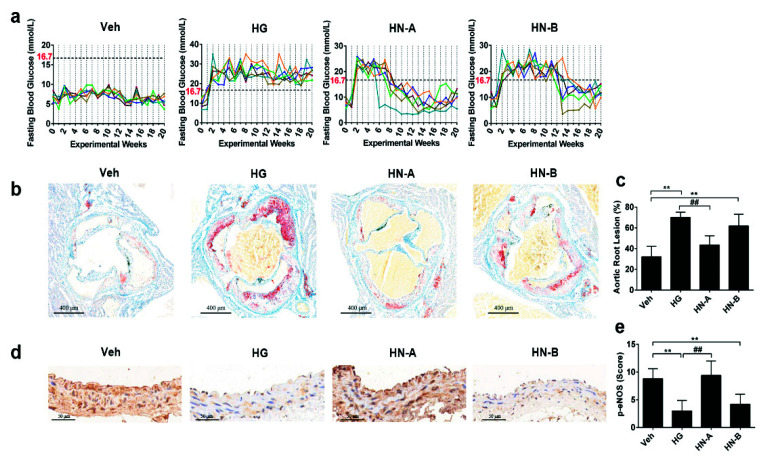
Figure 4.
High-glucose-induced vascular injury in vivo. (a) The fasting blood glucose of mice. (b,c) Oil red staining and quantitative analysis of atherosclerotic lesions at the aortic root. (d,e) Immunohistochemical staining and quantification of p-eNOS on abdominal aortic sections. Data are expressed as the mean ± SEM. n = 6 for each group. ** p < 0.01 vs. control (the Veh group); ## p < 0.01 vs. HG.

