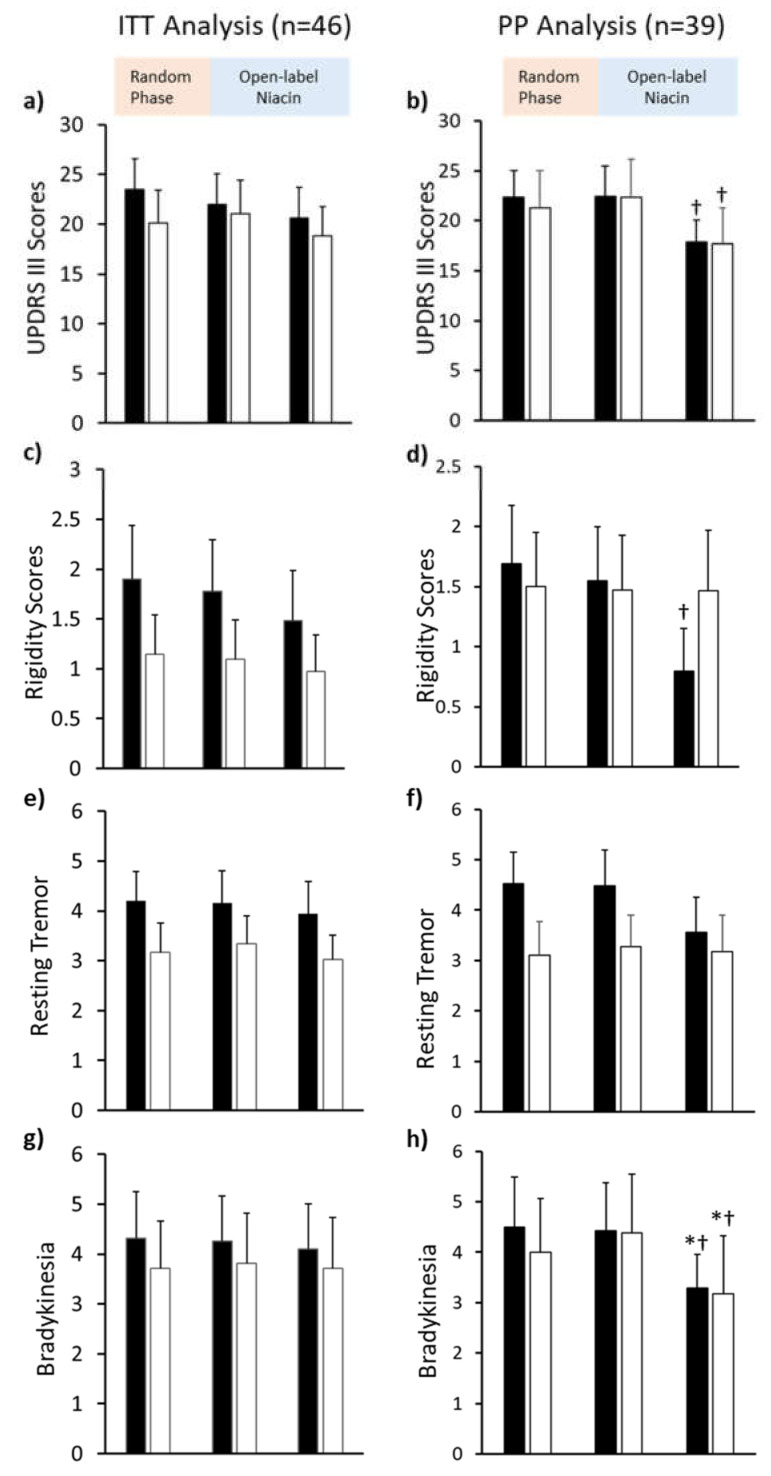
Figure 2.
Mean Unified Parkinson’s Disease Rating Scale III (UPDRS III) scores for two treatment groups analyzed per-protocol (right) and intention-to-treat with last observation carried forward (left). (a,b) Bar plot comparing changes in UPDRS III scores at baseline, after six months (6MO) of placebo (grey bars) or niacin (open bars), and after six months of niacin thereafter (12MO) (maximum points: 108). (c,d) Bar plot for rigidity scores (maximum points: 20), as a component of the UPDRS III scores, (e,f) Bar plot showing resting tremor scores (maximum points: 20), as a component of UPDRS III scores, and (g,h) Bar plot showing for bradykinesia scores (maximum points: 20), as a component of UPDRS III scores. * 12-month compared to baseline p < 0.05, † 12-month compared to 6-month p < 0.05. Values presented are mean ± SEM.

