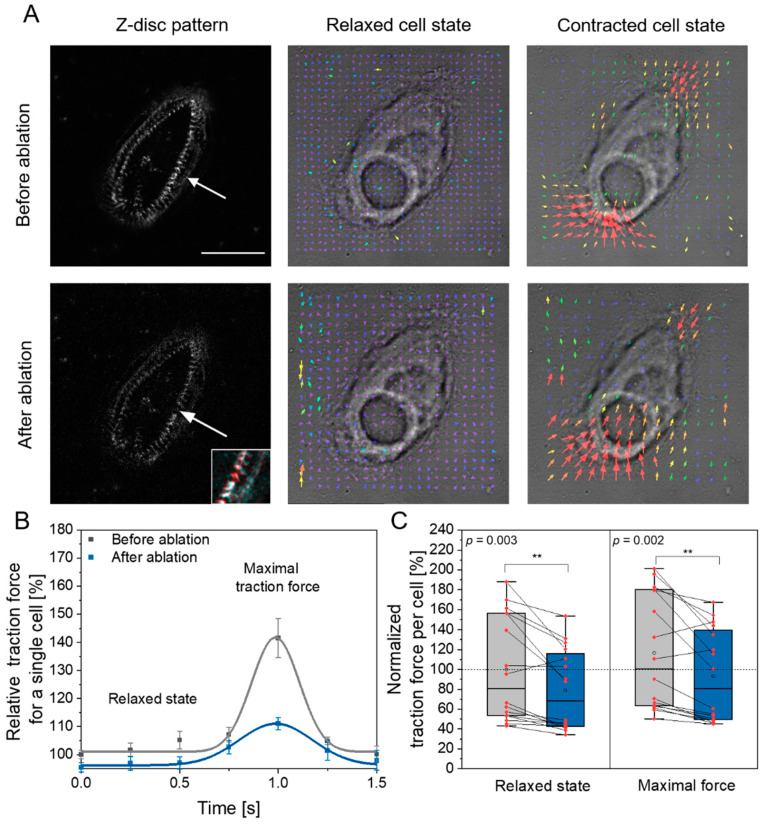
Figure 2.
Traction force microscopy of hPSC-derived CMs before and after laser ablation of a single Z-disc. (A) Microscopic presentation of the same cell before and after ablation of a single Z-disc (arrow) in the relaxed and the contracted state. Left images show the Z-disc pattern in a relaxed cell, the small magnified image in the right corner highlights the removed Z-disc in a colored overlay of the pattern before (red) and after (cyan) Z-disc removal. Right images present force vectors from traction force microscopy in relaxed and contracted state. Scale bar 50 µm. (B) Outline of relative force determined via traction force microscopy. The measured curves were obtained by averaging twitches of a single cell and are normalized to the force of the relaxed state before ablation. A lower magnitude of the maximum contractile force after ablation is visible. (C) Analysis of the force produced by each cell before and after Z-disc removal in the relaxed and state of maximal force. Data are normalized to the mean maximal force before laser ablation (mean of grey box (open circle)). Data are based on 16 cells and at least 10 contractions per cell were analyzed. A significant lower force (**) was observed after ablation of a Z-disc.

