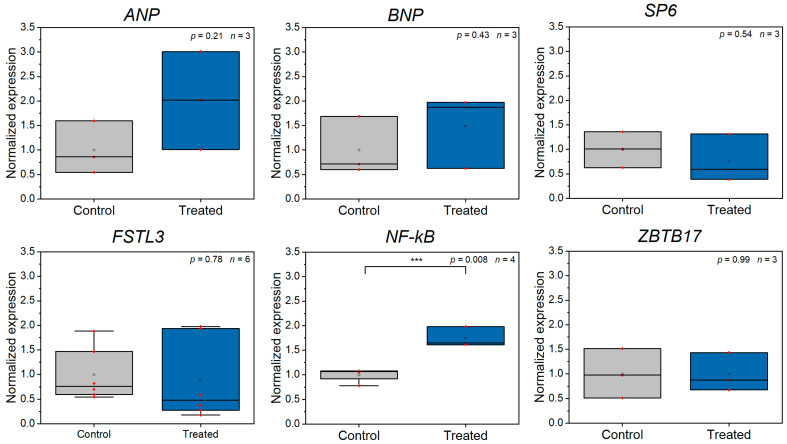
Figure 3.
RT-qPCR analysis of stress-related gene expression comparing control CMs and CMs, which were laser manipulated (n ≥ 3 experiments). NF-kB was significantly upregulated (***) after Z-disc removal. All data were calculated according to Taylor et al. [39] and are normalized to the mean of the control group, small red dots present raw data.

