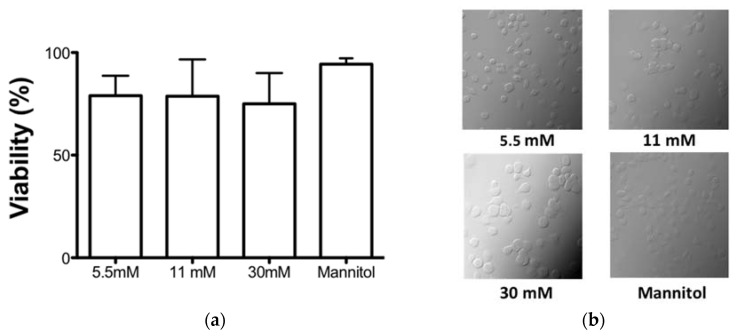
Figure 1.
Effect of glucose concentrations on cell viability. The cells were treated in the presence of 5.5, 11, and 30 mM glucose and mannitol for 7 days. (a) The viability was quantified by WST-1 reduction and the number of viable cells is expressed as the percent of reduction of WST-1 compared with the control. Data were expressed as mean SEM from four independent experiments. (b) Representative phase contrast micrographs showing the effect of different glucose concentration or mannitol in human cells.

