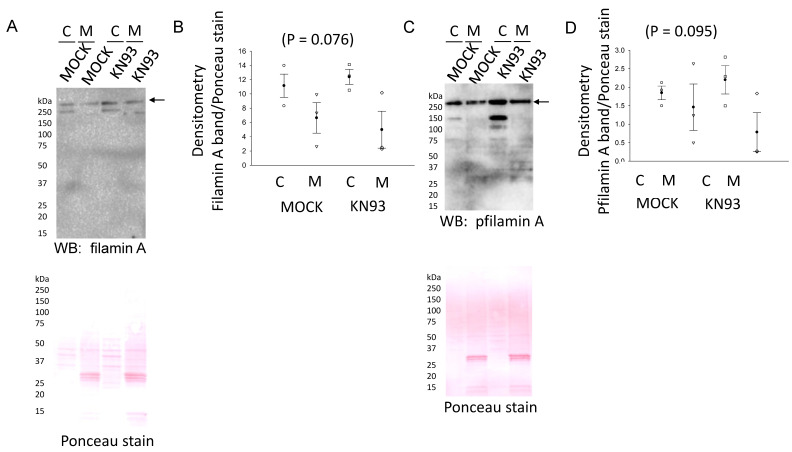
Figure 9.
Filamin A protein expression and phosphorylation after KN93 treatment in mDCT15 cells. (A) Western blot analysis of filamin A protein expression in the cytoplasmic (C) and membrane (M) fractions of mDCT15 cells. (B) Densitometric analysis of the filamin A immunoreactive bands indicated by an arrow in (A). (C) Western blot analysis of the phospho-filamin A (pfilamin A) protein expression in the cytoplasmic (C) and membrane (M) fractions of mDCT15 cells. (D) Densitometric analysis of the filamin A immunoreactive bands indicated by an arrow in (C).

