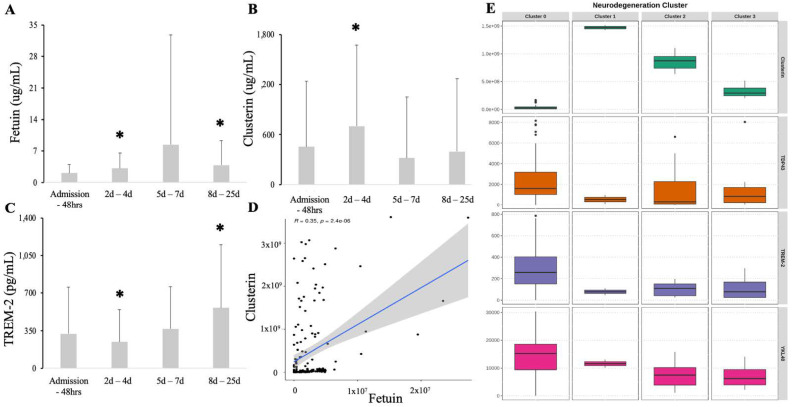
Figure 3.
Serum levels of fetuin (A), clusterin (B), and TREM-2 (C) compared to admission. The correlation between fetuin and clusterin serum levels (D). Clusterin analysis revealed 4 clusters (E), one with depletion of clusterin (#0) while the clusters #1, #2, #3 are signified by depletion of TREM-2. * Statistical difference when compared to all patients at admission (p < 0.05).

