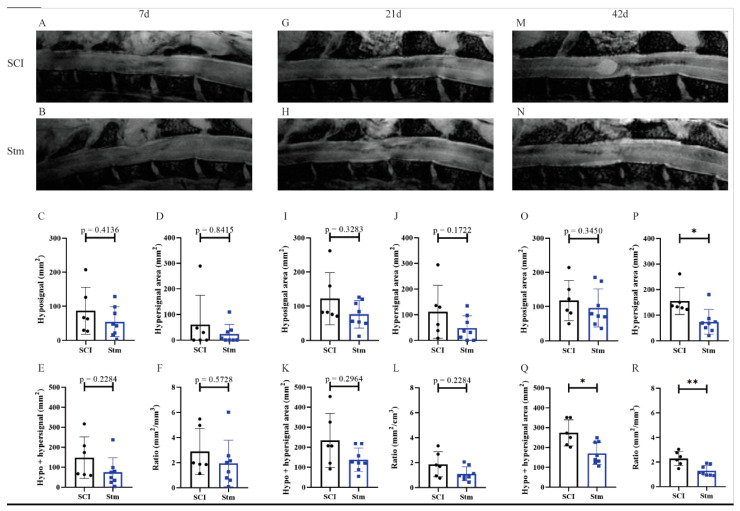
Figure 7.
MRI analyses show that rTSMS treatment decreases cystic cavities and increases spinal cord spared tissue. At (A–F) 7, (G–L) 21 and (M–R) 42 days, MRI experiments were performed. Representative images of sagittal spinal cord sections recorded with MRI of (A,G,M) SCI and (B,H,N) Stm (rTSMS treated) animals. Quantification of hyposignal area (C) 7, (I) 14 and (O) 42 days after SCI. Quantification of hypersignal area (D) 7, (J) 14 and (P) 42 days after SCI. Quantification of hypo + hypersignal area (E) 7, (K) 14 and (Q) 42 days after SCI. Quantification of ratio lesioned tissue (F) 7, (L) 14 and (R) 42 days after SCI; n = 6 animals per control group and n= 8 per Stm group. Quantifications are expressed as average ± SD. Statistical evaluations are based on the Mann–Whitney test (* = p < 0.05 and ** = p < 0.01).

