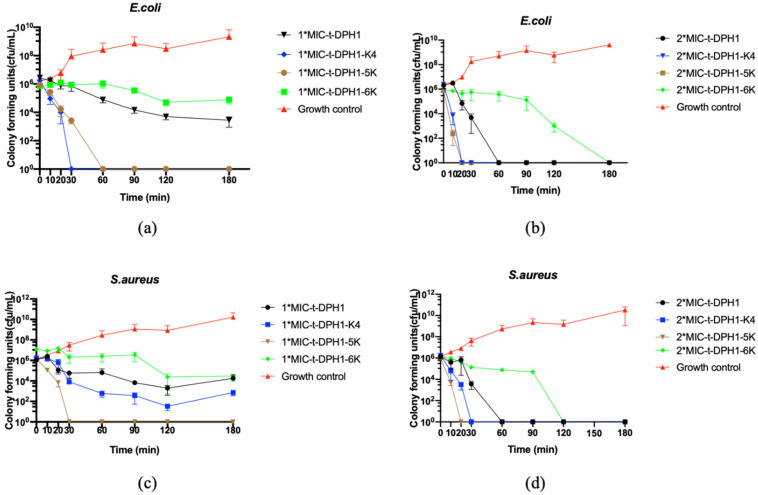
Figure 5.
The time–killing curves of t-DPH1, t-DPH1-K4, t-DPH1-5K and t-DPH1-6K against E. coli and S. aureus over 180 min. (a) Peptides against E. coli at the concentrations of 1*MIC; (b) Peptides against E. coli at the concentrations of 2*MIC; (c) Peptides against S. aureus at the concentrations of 1*MIC; (d) Peptides against S. aureus at the concentrations of 2*MIC. The error bars represent the mean ± SD of nine replicates.

